Columbia Sportswear 2011 Annual Report Download - page 43
Download and view the complete annual report
Please find page 43 of the 2011 Columbia Sportswear annual report below. You can navigate through the pages in the report by either clicking on the pages listed below, or by using the keyword search tool below to find specific information within the annual report.-
 1
1 -
2
-
3
-
4
-
5
-
6
-
7
-
8
-
9
-
10
-
11
-
12
-
13
-
14
-
15
-
16
-
17
-
18
-
19
-
20
-
21
-
22
-
23
-
24
-
25
-
26
-
27
-
28
-
29
-
30
-
31
-
32
-
 33
33 -
 34
34 -
 35
35 -
 36
36 -
 37
37 -
 38
38 -
 39
39 -
 40
40 -
 41
41 -
 42
42 -
 43
43 -
 44
44 -
 45
45 -
 46
46 -
 47
47 -
 48
48 -
 49
49 -
 50
50 -
 51
51 -
 52
52 -
 53
53 -
54
-
55
-
56
-
57
-
58
-
59
-
60
-
61
-
62
-
63
-
64
-
65
-
66
-
67
-
68
-
69
-
70
-
71
-
72
-
73
-
74
-
75
-
76
-
77
-
78
-
79
-
80
-
81
-
82
-
83
-
84
-
85
-
86
 |
 |

We expect to fund our future capital expenditures with existing cash, operating cash flows and credit
facilities. If the need arises, we may need to seek additional funding. Our ability to obtain additional financing
will depend on many factors, including prevailing market conditions, our financial condition, and our ability to
negotiate favorable terms and conditions. Financing may not be available on terms that are acceptable or
favorable to us, if at all.
Our operations are affected by seasonal trends typical in the outdoor apparel industry, and have historically
resulted in higher sales and profits in the third and fourth calendar quarters. This pattern has resulted primarily
from the timing of shipments of fall season products to wholesale customers and proportionally higher sales from
our direct-to-consumer operations in the fourth quarter. We believe that our liquidity requirements for at least the
next 12 months will be adequately covered by existing cash, cash provided by operations and existing short-term
borrowing arrangements.
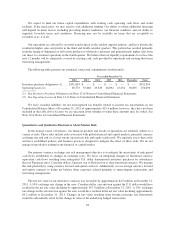
The following table presents our estimated contractual commitments (in thousands):
Year ended December 31,
2012 2013 2014 2015 2016 Thereafter Total
Inventory purchase obligations (1) . . . $351,854 $ — $ — $ — $ — $ — $351,854
Operating leases (2) ............... 38,773 35,060 29,819 26,892 25,254 94,892 250,690
(1) See Inventory Purchase Obligations in Note 13 of Notes to Consolidated Financial Statements.
(2) See Operating Leases in Note 13 of Notes to Consolidated Financial Statements.
We have recorded liabilities for net unrecognized tax benefits related to income tax uncertainties in our
Consolidated Balance Sheet at December 31, 2011 of approximately $15.4 million; however, they have not been
included in the table above because we are uncertain about whether or when these amounts may be settled. See
Note 10 of Notes to Consolidated Financial Statements.
Quantitative and Qualitative Disclosures About Market Risk
In the normal course of business, our financial position and results of operations are routinely subject to a
variety of risks. These risks include risks associated with global financial and capital markets, primarily currency
exchange rate risk and, to a lesser extent, interest rate risk and equity market risk. We regularly assess these risks
and have established policies and business practices designed to mitigate the effect of these risks. We do not
engage in speculative trading in any financial or capital market.
Our primary currency exchange rate risk management objective is to mitigate the uncertainty of anticipated
cash flows attributable to changes in exchange rates. We focus on mitigating changes in functional currency
equivalent cash flows resulting from anticipated U.S. dollar denominated inventory purchases by subsidiaries
that use European euros, Canadian dollars, Japanese yen or Korean won as their functional currency. We manage
this risk primarily by using currency forward and option contracts. Additionally, we use foreign currency forward
and option contracts to hedge net balance sheet exposures related primarily to intercompany transactions and
borrowing arrangements.
The net fair value of our derivative contracts was favorable by approximately $4.5 million at December 31,
2011. A 10% exchange rate change in the euro, Canadian dollar, yen and won against the U.S. dollar would have
resulted in the net fair value declining by approximately $17.0 million at December 31, 2011. A 10% exchange
rate change in the yen and won against the euro would have resulted in the net fair value declining approximately
$4.2 million at December 31, 2011. Changes in fair value resulting from foreign exchange rate fluctuations
would be substantially offset by the change in value of the underlying hedged transactions.
38