Columbia Sportswear 2011 Annual Report Download - page 59
Download and view the complete annual report
Please find page 59 of the 2011 Columbia Sportswear annual report below. You can navigate through the pages in the report by either clicking on the pages listed below, or by using the keyword search tool below to find specific information within the annual report.-
 1
1 -
2
-
3
-
4
-
5
-
6
-
7
-
8
-
9
-
10
-
11
-
12
-
13
-
14
-
15
-
16
-
17
-
18
-
19
-
20
-
21
-
22
-
23
-
24
-
25
-
26
-
27
-
28
-
29
-
30
-
31
-
32
-
33
-
34
-
35
-
36
-
37
-
38
-
39
-
40
-
41
-
42
-
43
-
44
-
45
-
46
-
47
-
48
-
 49
49 -
 50
50 -
 51
51 -
 52
52 -
 53
53 -
 54
54 -
 55
55 -
 56
56 -
 57
57 -
 58
58 -
 59
59 -
 60
60 -
 61
61 -
 62
62 -
 63
63 -
 64
64 -
 65
65 -
 66
66 -
 67
67 -
 68
68 -
 69
69 -
70
-
71
-
72
-
73
-
74
-
75
-
76
-
77
-
78
-
79
-
80
-
81
-
82
-
83
-
84
-
85
-
86
 |
 |

COLUMBIA SPORTSWEAR COMPANY
NOTES TO CONSOLIDATED FINANCIAL STATEMENTS—(Continued)
$3,000,000 at December 31, 2011. The majority of the Company’s derivative counterparties have strong credit
ratings and as a result, the Company does not require collateral to facilitate transactions. See Note 19 for further
disclosures concerning derivatives.
Country and supplier concentrations
The Company’s products are produced by independent factories located outside the United States,
principally in Southeast Asia. Apparel is manufactured in more than 15 countries, with Vietnam and China
accounting for approximately 73% of 2011 global apparel production. Footwear is manufactured in three
countries, with China and Vietnam accounting for approximately 92% of 2011 global footwear production. The
five largest apparel factory groups accounted for approximately 25% of 2011 global apparel production, with the
largest factory group accounting for 9% of 2011 global apparel production. The five largest footwear factory
groups accounted for approximately 72% of 2011 global footwear production, with the largest factory group
accounting for 25% of 2011 global footwear production. In addition, a single vendor supplies substantially all of
the zippers used in the Company’s products. These companies, however, have multiple factory locations, many
of which are in different countries, thus reducing the risk that unfavorable conditions at a single factory or
location will have a material adverse effect on the Company.
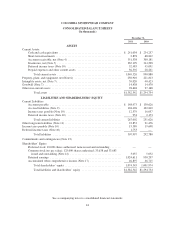
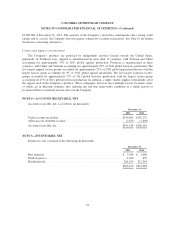
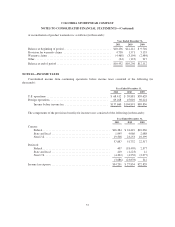
NOTE 4—ACCOUNTS RECEIVABLE, NET
Accounts receivable, net, is as follows (in thousands):
December 31,
2011 2010
Trade accounts receivable ........................................... $359,083 $307,279
Allowance for doubtful accounts ..................................... (7,545) (7,098)
Accounts receivable, net ............................................ $351,538 $300,181
NOTE 5—INVENTORIES, NET
Inventories, net, consisted of the following (in thousands):
December 31,
2011 2010
Raw materials .................................................... $ 2,044 $ 1,096
Work in process ................................................... 1,240 659
Finished goods .................................................... 361,915 312,543
$365,199 $314,298
54