Columbia Sportswear 2011 Annual Report Download - page 42
Download and view the complete annual report
Please find page 42 of the 2011 Columbia Sportswear annual report below. You can navigate through the pages in the report by either clicking on the pages listed below, or by using the keyword search tool below to find specific information within the annual report.-
 1
1 -
2
-
3
-
4
-
5
-
6
-
7
-
8
-
9
-
10
-
11
-
12
-
13
-
14
-
15
-
16
-
17
-
18
-
19
-
20
-
21
-
22
-
23
-
24
-
25
-
26
-
27
-
28
-
29
-
30
-
31
-
 32
32 -
 33
33 -
 34
34 -
 35
35 -
 36
36 -
 37
37 -
 38
38 -
 39
39 -
 40
40 -
 41
41 -
 42
42 -
 43
43 -
 44
44 -
 45
45 -
 46
46 -
 47
47 -
 48
48 -
 49
49 -
 50
50 -
 51
51 -
 52
52 -
53
-
54
-
55
-
56
-
57
-
58
-
59
-
60
-
61
-
62
-
63
-
64
-
65
-
66
-
67
-
68
-
69
-
70
-
71
-
72
-
73
-
74
-
75
-
76
-
77
-
78
-
79
-
80
-
81
-
82
-
83
-
84
-
85
-
86
 |
 |
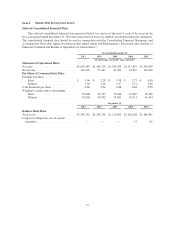
2011 compared to 2010
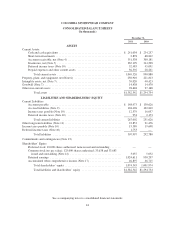
Net cash provided by operating activities was $63.8 million in 2011 compared to $23.5 million in 2010. The
increase in cash provided by operating activities was primarily due to increased income from operations,
combined with a reduction in the rate of growth of accounts receivable and inventory; partially offset by a
reduction in the rate of growth of accounts payable and accrued liabilities, an increase in prepaid expenses and an
increase in income taxes paid compared to 2010.
Net cash used in investing activities was $12.5 million in 2011 compared to $91.2 million in 2010. For
2011, net cash used in investing activities primarily consisted of $78.4 million for capital expenditures, partially
offset by $65.7 million for net sales of short-term investments. For 2010, net cash used in investing activities
primarily consisted of $46.1 million for net purchases of short-term investments, $28.8 million for capital
expenditures and $16.3 million for acquisitions.
Net cash used in financing activities was $39.2 million in 2011 compared to $82.3 million in 2010. For
2011, net cash used in financing activities primarily consisted of dividend payments of $29.1 million and the
repurchase of common stock at an aggregate price of $20.0 million, partially offset by net proceeds of $8.0
million from the issuance of common stock. For 2010, net cash used in financing activities primarily consisted of
dividend payments of $75.4 million, including a $50.5 million special dividend paid in December 2010, and the
repurchase of common stock at an aggregate price of $13.8 million, partially offset by net proceeds of $6.5
million from the issuance of common stock.
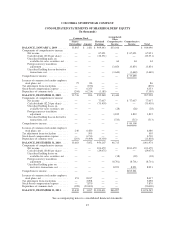
2010 compared to 2009
Net cash provided by operating activities was $23.5 million in 2010 compared to $214.4 million in 2009.
The decrease in cash provided by operating activities was primarily the result of increases in inventory and
accounts receivable in 2010 compared to decreases in accounts receivable and inventory in 2009, partially offset
by increases in accounts payable and accrued liabilities in 2010 compared to a net decrease in accounts payable
and accrued liabilities in 2009. The increase in inventory was due to a larger volume of excess fall 2010
inventory designated for sale primarily through our own outlet retail stores compared to fall 2009 inventory,
earlier receipt of spring 2011 inventory compared to spring 2010 inventory, increased 2010 replenishment
inventory compared to 2009 and incremental inventory to support increased direct-to-consumer sales. The
increase in accounts receivable was in line with the 19% increase in net sales and was also due to an increase in
close-out product sales and shipment of spring 2011 advance orders close to the end of the 2010 period.
Net cash used in investing activities was $91.2 million in 2010 compared to net cash used in investing
activities of $33.2 million in 2009. For the 2010 period, net cash used in investing activities primarily consisted
of $46.1 million for the net purchases of short-term investments, $28.8 million for capital expenditures and $16.3
million for acquisitions. For the 2009 period, net cash used in investing activities primarily consisted of capital
expenditures of $33.1 million.
Net cash used in financing activities was $82.3 million in 2010 compared to $29.6 million in 2009. For the
2010 period, net cash used in financing activities primarily consisted of dividend payments of $75.4 million,
including a $50.5 million special dividend paid in December 2010, and the repurchase of common stock at an
aggregate price of $13.8 million, partially offset by proceeds from issuance of common stock of $6.5 million. For
the 2009 period, net cash used in financing activities included dividend payments of $22.3 million and the
repurchase of common stock at an aggregate price of $7.4 million.
We have an unsecured, committed $125.0 million revolving line of credit available to fund our domestic
working capital requirements. At December 31, 2011, no balance was outstanding under this line of credit and
we were in compliance with all associated covenants. Internationally, our subsidiaries have local currency
operating lines of credit in place guaranteed by the parent company with a combined limit of approximately
$89.7 million at December 31, 2011, of which $3.2 million is designated as a European customs guarantee. At
December 31, 2011, no balance was outstanding under these lines of credit.
37