Columbia Sportswear 2011 Annual Report Download - page 40
Download and view the complete annual report
Please find page 40 of the 2011 Columbia Sportswear annual report below. You can navigate through the pages in the report by either clicking on the pages listed below, or by using the keyword search tool below to find specific information within the annual report.-
 1
1 -
2
-
3
-
4
-
5
-
6
-
7
-
8
-
9
-
10
-
11
-
12
-
13
-
14
-
15
-
16
-
17
-
18
-
19
-
20
-
21
-
22
-
23
-
24
-
25
-
26
-
27
-
28
-
29
-
 30
30 -
 31
31 -
 32
32 -
 33
33 -
 34
34 -
 35
35 -
 36
36 -
 37
37 -
 38
38 -
 39
39 -
 40
40 -
 41
41 -
 42
42 -
 43
43 -
 44
44 -
 45
45 -
 46
46 -
 47
47 -
 48
48 -
 49
49 -
 50
50 -
51
-
52
-
53
-
54
-
55
-
56
-
57
-
58
-
59
-
60
-
61
-
62
-
63
-
64
-
65
-
66
-
67
-
68
-
69
-
70
-
71
-
72
-
73
-
74
-
75
-
76
-
77
-
78
-
79
-
80
-
81
-
82
-
83
-
84
-
85
-
86
 |
 |

shift in the timing of shipments as a higher percentage of spring 2011 shipments occurred in the fourth quarter of
2010, while a higher percentage of spring 2010 shipments occurred in the first quarter of 2010. The increase in
EMEA direct net sales was primarily the result of increased net sales of Sorel-branded footwear.
Net sales in Canada increased $10.2 million, or 10%, to $116.7 million in 2010 from $106.5 million in
2009. Changes in foreign currency exchange rates compared to 2009 contributed eight percentage points of
benefit to the Canada net sales comparison.
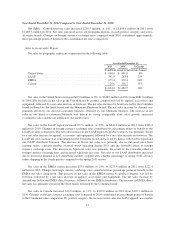
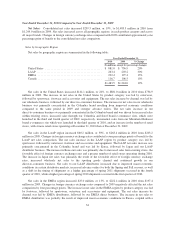
Sales by Product Category
Net sales by product category are summarized in the following table:
Year Ended December 31,
2010 2009 % Change
(In millions, except for percentage changes)
Apparel, accessories and equipment ...................... $1,213.3 $1,029.4 18%
Footwear ........................................... 270.2 214.6 26%
$1,483.5 $1,244.0 19%
Net sales of apparel, accessories and equipment increased $183.9 million, or 18%, to $1,213.3 million in
2010 from $1,029.4 million in 2009. The increase in apparel, accessories and equipment net sales was primarily
concentrated in the Columbia brand and was led by the United States, followed by the LAAP region, Canada and
the EMEA region. The net sales increase in apparel, accessories and equipment in the United States was led by
our wholesale business, followed by our direct-to-consumer business. The apparel, accessories and equipment net
sales increase in the LAAP region was led by Korea, followed by Japan and our LAAP distributor business.
Net sales of footwear increased $55.6 million, or 26%, to $270.2 million in 2010 from $214.6 million in
2009. The increase in footwear net sales by brand was led by the Sorel brand, followed by the Columbia brand.
The footwear net sales increase by region was led by the United States, followed by the EMEA region, the LAAP
region and Canada. The net sales increase in footwear in the United States was led by our wholesale business,
followed by our direct-to-consumer business. The footwear net sales increase in the EMEA region was led by our
EMEA direct business, followed by our EMEA distributor business. The LAAP footwear net sales increase was
led by our LAAP distributor business, followed by Korea and Japan.
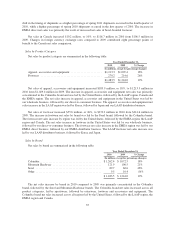
Sales by Brand
Net sales by brand are summarized in the following table:
Year Ended December 31,
2010 2009 % Change
(In millions, except for percentage changes)
Columbia ........................................... $1,262.4 $ 1,072.5 18%
Mountain Hardwear .................................. 121.9 100.5 21%
Sorel .............................................. 89.7 60.6 48%
Other .............................................. 9.5 10.4 (9)%
$ 1,483.5 $ 1,244.0 19%
The net sales increase by brand in 2010 compared to 2009 was primarily concentrated in the Columbia
brand, followed by the Sorel and Mountain Hardwear brands. The Columbia brand net sales increased across all
product categories, led by sportswear, followed by outerwear, footwear and accessories and equipment. The
Columbia brand net sales increased across all regions led by the United States, followed by the LAAP region, the
EMEA region and Canada.
35