Columbia Sportswear 2011 Annual Report Download - page 38
Download and view the complete annual report
Please find page 38 of the 2011 Columbia Sportswear annual report below. You can navigate through the pages in the report by either clicking on the pages listed below, or by using the keyword search tool below to find specific information within the annual report.-
 1
1 -
2
-
3
-
4
-
5
-
6
-
7
-
8
-
9
-
10
-
11
-
12
-
13
-
14
-
15
-
16
-
17
-
18
-
19
-
20
-
21
-
22
-
23
-
24
-
25
-
26
-
27
-
 28
28 -
 29
29 -
 30
30 -
 31
31 -
 32
32 -
 33
33 -
 34
34 -
 35
35 -
 36
36 -
 37
37 -
 38
38 -
 39
39 -
 40
40 -
 41
41 -
 42
42 -
 43
43 -
 44
44 -
 45
45 -
 46
46 -
 47
47 -
 48
48 -
49
-
50
-
51
-
52
-
53
-
54
-
55
-
56
-
57
-
58
-
59
-
60
-
61
-
62
-
63
-
64
-
65
-
66
-
67
-
68
-
69
-
70
-
71
-
72
-
73
-
74
-
75
-
76
-
77
-
78
-
79
-
80
-
81
-
82
-
83
-
84
-
85
-
86
 |
 |
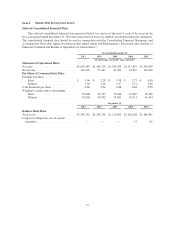
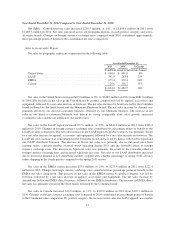
Gross Profit: Gross profit as a percentage of net sales increased to 43.4% in 2011 from 42.4% in 2010,
driven primarily by lower airfreight costs compared to 2010. Other factors favorably affecting gross margin
included:
• Favorable foreign currency hedge rates; and
• A higher proportion of direct-to-consumer sales at higher gross margins;
partially offset by:
• Increased product costs;
• A higher proportion of close-out product sales; and
• An increased proportion of shipments to EMEA and LAAP distributors.
Our gross profit may not be comparable to those of other companies in our industry because some of these
companies include all of the costs related to their distribution network in cost of sales while we, like many others,
include these expenses as a component of SG&A expense.
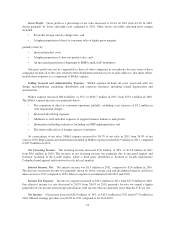
Selling, General and Administrative Expense: SG&A expense includes all costs associated with our
design, merchandising, marketing, distribution and corporate functions, including related depreciation and
amortization.
SG&A expense increased $80.6 million, or 15%, to $614.7 million in 2011, from $534.1 million in 2010.
The SG&A expense increase was primarily due to:
• The expansion of direct-to-consumer operations globally, including a net increase of $3.2 million in
store impairment charges;
• Increased advertising expenses;
• Additions to staff and other expenses to support business initiatives and growth;
• Information technology initiatives, including our ERP implementation; and
• The unfavorable effect of foreign currency translation.
As a percentage of net sales, SG&A expense increased to 36.3% of net sales in 2011 from 36.0% of net
sales in 2010. Depreciation and amortization included in SG&A expense totaled $42.9 million in 2011, compared
to $37.8 million in 2010.
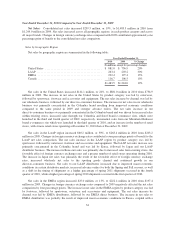
Net Licensing Income: Net licensing income increased $7.8 million, or 98%, to $15.8 million in 2011
from $8.0 million in 2010. The increase in net licensing income was primarily due to increased apparel and
footwear licensing in the LAAP region, where a third party distributor is licensed to locally manufacture
Columbia brand apparel and footwear for sale in local markets.
Interest Income, Net: Net interest income was $1.3 million in 2011, compared to $1.6 million in 2010.
The decrease in interest income was primarily driven by lower average cash and investment balances and lower
interest rates in 2011 compared to 2010. Interest expense was nominal in both 2011 and 2010.
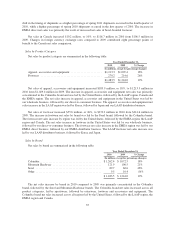
Income Tax Expense: Income tax expense increased to $34.2 million in 2011 from $27.9 million in 2010.
Our effective income tax rate decreased to 24.8% from 26.6% in 2010, primarily because we earned a higher
proportion of our income from foreign jurisdictions with tax rates that are generally lower than the U.S. tax rate.
Net Income: Net income increased $26.4 million, or 34%, to $103.5 million in 2011 from $77.0 million in
2010. Diluted earnings per share was $3.03 in 2011 compared to $2.26 in 2010.
33