Columbia Sportswear 2011 Annual Report Download - page 51
Download and view the complete annual report
Please find page 51 of the 2011 Columbia Sportswear annual report below. You can navigate through the pages in the report by either clicking on the pages listed below, or by using the keyword search tool below to find specific information within the annual report.-
 1
1 -
2
-
3
-
4
-
5
-
6
-
7
-
8
-
9
-
10
-
11
-
12
-
13
-
14
-
15
-
16
-
17
-
18
-
19
-
20
-
21
-
22
-
23
-
24
-
25
-
26
-
27
-
28
-
29
-
30
-
31
-
32
-
33
-
34
-
35
-
36
-
37
-
38
-
39
-
40
-
 41
41 -
 42
42 -
 43
43 -
 44
44 -
 45
45 -
 46
46 -
 47
47 -
 48
48 -
 49
49 -
 50
50 -
 51
51 -
 52
52 -
 53
53 -
 54
54 -
 55
55 -
 56
56 -
 57
57 -
 58
58 -
 59
59 -
 60
60 -
 61
61 -
62
-
63
-
64
-
65
-
66
-
67
-
68
-
69
-
70
-
71
-
72
-
73
-
74
-
75
-
76
-
77
-
78
-
79
-
80
-
81
-
82
-
83
-
84
-
85
-
86
 |
 |

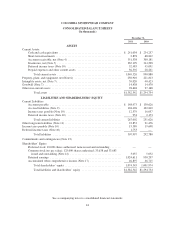
COLUMBIA SPORTSWEAR COMPANY
CONSOLIDATED STATEMENTS OF CASH FLOWS
(In thousands)
Year Ended December 31,
2011 2010 2009
Cash flows from operating activities:
Net income ................................................ $103,479 $ 77,037 $ 67,021
Adjustments to reconcile net income to net cash provided by operating
activities:
Depreciation and amortization ............................ 43,560 38,430 36,253
Loss on disposal or impairment of property, plant, and
equipment .......................................... 6,485 3,331 1,828
Deferred income taxes ................................... (3,582) (22,610) 55
Stock-based compensation ............................... 7,870 6,730 6,353
Excess tax benefit from employee stock plans ................ (1,828) (498) (41)
Changes in operating assets and liabilities:
Accounts receivable ................................. (54,334) (69,500) 77,490
Inventories ........................................ (55,223) (87,265) 38,831
Prepaid expenses and other current assets ................ (10,186) 3,856 (1,695)
Other assets ....................................... (4,520) (1,566) (5,179)
Accounts payable ................................... 19,081 26,028 (16,944)
Accrued liabilities .................................. 17,630 34,224 7,563
Income taxes payable ................................ (7,010) 9,018 (1,558)
Other liabilities .................................... 2,374 6,302 4,395
Net cash provided by operating activities ............ 63,796 23,517 214,372
Cash flows from investing activities:
Purchases of short-term investments ............................ (46,349) (81,671) (25,305)
Sales of short-term investments ................................ 112,070 35,601 25,163
Capital expenditures ........................................ (78,404) (28,838) (33,074)
Proceeds from sale of property, plant, and equipment .............. 168 42 31
Acquisitions, net of cash acquired .............................. — (16,315) —
Net cash used in investing activities ................ (12,515) (91,181) (33,185)
Cash flows from financing activities:
Proceeds from credit facilities ................................. 119,384 31,680 57,588
Repayments on credit facilities ................................ (119,384) (31,680) (57,588)
Repayment on other long-term liabilities ........................ — — (4)
Proceeds from issuance of common stock under employee stock
plans ................................................... 10,991 7,333 710
Tax payments related to restricted stock unit issuances ............. (2,974) (853) (624)
Excess tax benefit from employee stock plans .................... 1,828 498 41
Repurchase of common stock ................................. (20,000) (13,838) (7,399)
Cash dividends paid ......................................... (29,075) (75,439) (22,331)
Net cash used in financing activities ................ (39,230) (82,299) (29,607)
Net effect of exchange rate changes on cash ........................ (5,274) (2,444) 4,467
Net increase (decrease) in cash and cash equivalents ................. 6,777 (152,407) 156,047
Cash and cash equivalents, beginning of year ...................... 234,257 386,664 230,617
Cash and cash equivalents, end of year ............................ $241,034 $ 234,257 $386,664
Supplemental disclosures of cash flow information:
Cash paid during the year for interest ........................... $ 183 $ 76 $ 35
Cash paid during the year for income taxes ...................... 42,405 34,924 31,284
Supplemental disclosures of non-cash investing activities:
Capital expenditures incurred but not yet paid .................... 952 1,001 7,852
See accompanying notes to consolidated financial statements
46