Columbia Sportswear 2011 Annual Report Download - page 35
Download and view the complete annual report
Please find page 35 of the 2011 Columbia Sportswear annual report below. You can navigate through the pages in the report by either clicking on the pages listed below, or by using the keyword search tool below to find specific information within the annual report.-
 1
1 -
2
-
3
-
4
-
5
-
6
-
7
-
8
-
9
-
10
-
11
-
12
-
13
-
14
-
15
-
16
-
17
-
18
-
19
-
20
-
21
-
22
-
23
-
24
-
 25
25 -
 26
26 -
 27
27 -
 28
28 -
 29
29 -
 30
30 -
 31
31 -
 32
32 -
 33
33 -
 34
34 -
 35
35 -
 36
36 -
 37
37 -
 38
38 -
 39
39 -
 40
40 -
 41
41 -
 42
42 -
 43
43 -
 44
44 -
 45
45 -
46
-
47
-
48
-
49
-
50
-
51
-
52
-
53
-
54
-
55
-
56
-
57
-
58
-
59
-
60
-
61
-
62
-
63
-
64
-
65
-
66
-
67
-
68
-
69
-
70
-
71
-
72
-
73
-
74
-
75
-
76
-
77
-
78
-
79
-
80
-
81
-
82
-
83
-
84
-
85
-
86
 |
 |

As our business model and strategies have evolved, management expects certain trends to continue to affect
our business and operating results, including:
• A higher amount of fixed operating expenses to support, among other things, direct-to-consumer
activities and our multi-year ERP implementation;
• A greater reliance on sales growth through the company’s global direct-to-consumer platform; and
• Higher product input costs.
We expect the unseasonably warm weather in the northern hemisphere during the 2011 and 2012 winter
season to subdue retailer confidence as they plan their orders for the Fall 2012 season. However, we remain
firmly committed to investing in innovation, enhanced design, our direct-to-consumer platform and compelling
marketing to elevate our brands and gain market share, and to investing in information technologies and process
improvements to increase operational and supply chain efficiencies and profitability. We are currently
implementing cost containment measures with the goal of limiting 2012 SG&A growth at a rate comparable to
anticipated 2012 sales growth.
These factors and others may have a material effect on our financial condition, results of operations, or cash
flows, particularly with respect to quarterly comparisons.
Results of Operations
The following discussion of our results of operations and liquidity and capital resources should be read in
conjunction with the Consolidated Financial Statements and accompanying Notes that appear elsewhere in this
annual report. All references to years relate to the calendar year ended December 31.
In 2011, we consolidated our categorical net sales reporting from four categories to two categories to better
reflect product category management oversight and structure. Net sales within the new apparel, accessories and
equipment product category consist of the combination of previously reported net sales of the outerwear,
sportswear and accessories and equipment product categories. The footwear product categorical reporting
remained unchanged. Previously reported product category net sales information for fiscal years 2010 and 2009
has been recast to reflect this change.
Highlights of the Year Ended December 31, 2011
• Net sales increased $210.5 million, or 14%, to $1,694.0 million in 2011 from $1,483.5 million in 2010.
Changes in foreign currency exchange rates compared with 2010 contributed approximately three
percentage points of benefit to the consolidated net sales comparison.
• Net income increased 34% to $103.5 million in 2011 from $77.0 million in 2010, and diluted earnings
per share increased to $3.03 in 2011 compared to $2.26 in 2010.
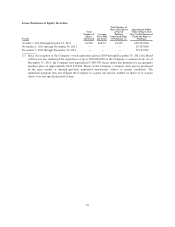
• We paid cash dividends totaling $0.86 per share, or $29.1 million, in 2011, which included a 10%
increase in the quarterly dividend to $0.22 per share from $0.20 per share in March 2011.
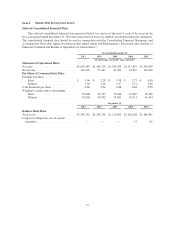
The following table sets forth, for the periods indicated, the percentage relationship to net sales of specified
items in our Consolidated Statements of Operations:
2011 2010 2009
Net sales ........................................................ 100.0% 100.0% 100.0%
Cost of sales ..................................................... 56.6 57.6 57.9
Gross profit ...................................................... 43.4 42.4 42.1
Selling, general and administrative expense ............................ 36.3 36.0 35.7
Net licensing income .............................................. 1.0 0.6 0.7
Income from operations ............................................ 8.1 7.0 7.1
Interest income, net ............................................... 0.0 0.1 0.1
Income before income tax .......................................... 8.1 7.1 7.2
Income tax expense ............................................... (2.0) (1.9) (1.8)
Net income ...................................................... 6.1% 5.2% 5.4%
30