Cigna 2013 Annual Report Download - page 96
Download and view the complete annual report
Please find page 96 of the 2013 Cigna annual report below. You can navigate through the pages in the report by either clicking on the pages listed below, or by using the keyword search tool below to find specific information within the annual report.-
 1
1 -
 2
2 -
 3
3 -
 4
4 -
 5
5 -
 6
6 -
 7
7 -
 8
8 -
 9
9 -
 10
10 -
 11
11 -
 12
12 -
 13
13 -
 14
14 -
 15
15 -
 16
16 -
 17
17 -
 18
18 -
 19
19 -
 20
20 -
 21
21 -
 22
22 -
 23
23 -
 24
24 -
 25
25 -
 26
26 -
 27
27 -
 28
28 -
 29
29 -
 30
30 -
 31
31 -
 32
32 -
 33
33 -
 34
34 -
 35
35 -
 36
36 -
 37
37 -
 38
38 -
 39
39 -
 40
40 -
 41
41 -
 42
42 -
 43
43 -
 44
44 -
 45
45 -
 46
46 -
 47
47 -
 48
48 -
 49
49 -
 50
50 -
 51
51 -
 52
52 -
 53
53 -
 54
54 -
 55
55 -
 56
56 -
 57
57 -
 58
58 -
 59
59 -
 60
60 -
 61
61 -
 62
62 -
 63
63 -
 64
64 -
 65
65 -
 66
66 -
 67
67 -
 68
68 -
 69
69 -
 70
70 -
 71
71 -
 72
72 -
 73
73 -
 74
74 -
 75
75 -
 76
76 -
 77
77 -
 78
78 -
 79
79 -
 80
80 -
 81
81 -
 82
82 -
 83
83 -
 84
84 -
 85
85 -
 86
86 -
 87
87 -
 88
88 -
 89
89 -
 90
90 -
 91
91 -
 92
92 -
 93
93 -
 94
94 -
 95
95 -
 96
96 -
 97
97 -
 98
98 -
 99
99 -
 100
100 -
 101
101 -
 102
102 -
 103
103 -
 104
104 -
 105
105 -
 106
106 -
 107
107 -
 108
108 -
 109
109 -
 110
110 -
 111
111 -
 112
112 -
 113
113 -
 114
114 -
 115
115 -
 116
116 -
 117
117 -
 118
118 -
 119
119 -
 120
120 -
 121
121 -
 122
122 -
 123
123 -
 124
124 -
 125
125 -
 126
126 -
 127
127 -
 128
128 -
 129
129 -
 130
130 -
 131
131 -
 132
132 -
 133
133 -
 134
134 -
 135
135 -
 136
136 -
 137
137 -
 138
138 -
 139
139 -
 140
140 -
 141
141 -
 142
142 -
 143
143 -
 144
144 -
 145
145 -
 146
146 -
 147
147 -
 148
148 -
 149
149 -
 150
150 -
 151
151 -
 152
152 -
 153
153 -
 154
154 -
 155
155 -
 156
156 -
 157
157 -
 158
158 -
 159
159 -
 160
160 -
 161
161 -
 162
162 -
 163
163 -
 164
164 -
 165
165 -
 166
166 -
 167
167 -
 168
168 -
 169
169 -
 170
170 -
 171
171 -
 172
172 -
 173
173 -
 174
174 -
 175
175 -
 176
176 -
 177
177 -
 178
178 -
 179
179 -
 180
180 -
 181
181 -
 182
182
 |
 |

PART II
ITEM 8. Financial Statements and Supplementary Data
Cigna Corporation
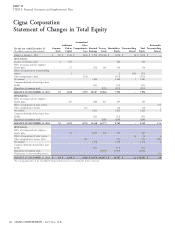
Statement of Changes in Total Equity
Accumulated
Additional Other Redeemable
Common Paid-in Comprehensive Retained Treasury Shareholders’ Noncontrolling Total Noncontrolling
For the year ended December 31,
(In millions, except per share amounts)
Stock Capital Loss Earnings Stock Equity Interest Equity Interest
Balance at January 1, 2011 $ 88 $ 2,534 $ (614) $ 9,590 $(5,242) $ 6,356 $ 18 $ 6,374 $ –
2011 Activity:
Issuance of common stock 4 625 629 629
Effect of issuing stock for employee
benefit plans 27 (52) 181 156 156
Effects of acquisition of noncontrolling
interest 2 2 (19) (17)
Other comprehensive (loss) (173) (173) (173)
Net income 1,260 1,260 1 1,261
Common dividends declared (per share:
$0.04) (11) (11) (11)
Repurchase of common stock (225) (225) (225)
BALANCE AT DECEMBER 31, 2011 92 3,188 (787) 10,787 (5,286) 7,994 – 7,994 –
2012 Activity:
Effect of issuing stock for employee
benefit plans 107 (69) 217 255 255
Effects of acquisition of joint venture 111
Other comprehensive income 116 116 116 2
Net income 1,623 1,623 1,623 1
Common dividends declared (per share:
$0.04) (11) (11) (11)
Repurchase of common stock (208) (208) (208)
BALANCE AT DECEMBER 31, 2012 92 3,295 (671) 12,330 (5,277) 9,769 – 9,769 114
2013 Activity:
Effect of issuing stock for employee
benefit plans 61 (119) 243 185 185
Effects of acquisition of joint venture 14 14 6
Other comprehensive income (loss) 151 151 151 (19)
Net income 1,476 1,476 1,476 2
Common dividends declared (per share:
$0.04) (11) (11) (11)
Repurchase of common stock (1,003) (1,003) (1,003)
Distribution to noncontrolling interest (7)
BALANCE AT DECEMBER 31, 2013 $ 92 $ 3,356 $ (520) $ 13,676 $(6,037) $ 10,567 $ 14 $10,581 $ 96
The accompanying Notes to the Consolidated Financial Statements are an integral part of these statements.
64 CIGNA CORPORATION - 2013 Form 10-K
