Cigna 2013 Annual Report Download - page 124
Download and view the complete annual report
Please find page 124 of the 2013 Cigna annual report below. You can navigate through the pages in the report by either clicking on the pages listed below, or by using the keyword search tool below to find specific information within the annual report.-
 1
1 -
2
-
3
-
4
-
5
-
6
-
7
-
8
-
9
-
10
-
11
-
12
-
13
-
14
-
15
-
16
-
17
-
18
-
19
-
20
-
21
-
22
-
23
-
24
-
25
-
26
-
27
-
28
-
29
-
30
-
31
-
32
-
33
-
34
-
35
-
36
-
37
-
38
-
39
-
40
-
41
-
42
-
43
-
44
-
45
-
46
-
47
-
48
-
49
-
50
-
51
-
52
-
53
-
54
-
55
-
56
-
57
-
58
-
59
-
60
-
61
-
62
-
63
-
64
-
65
-
66
-
67
-
68
-
69
-
70
-
71
-
72
-
73
-
74
-
75
-
76
-
77
-
78
-
79
-
80
-
81
-
82
-
83
-
84
-
85
-
86
-
87
-
88
-
89
-
90
-
91
-
92
-
93
-
94
-
95
-
96
-
97
-
98
-
99
-
100
-
101
-
102
-
103
-
104
-
105
-
106
-
107
-
108
-
109
-
110
-
111
-
112
-
113
-
 114
114 -
 115
115 -
 116
116 -
 117
117 -
 118
118 -
 119
119 -
 120
120 -
 121
121 -
 122
122 -
 123
123 -
 124
124 -
 125
125 -
 126
126 -
 127
127 -
 128
128 -
 129
129 -
 130
130 -
 131
131 -
 132
132 -
 133
133 -
 134
134 -
135
-
136
-
137
-
138
-
139
-
140
-
141
-
142
-
143
-
144
-
145
-
146
-
147
-
148
-
149
-
150
-
151
-
152
-
153
-
154
-
155
-
156
-
157
-
158
-
159
-
160
-
161
-
162
-
163
-
164
-
165
-
166
-
167
-
168
-
169
-
170
-
171
-
172
-
173
-
174
-
175
-
176
-
177
-
178
-
179
-
180
-
181
-
182
 |
 |
PART II
ITEM 8. Financial Statements and Supplementary Data
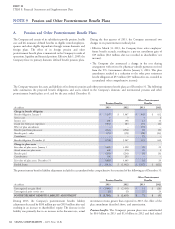
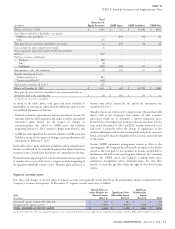
Quoted Prices in Significant
Active Markets for Significant Other Unobservable
Identical Assets Observable Inputs Inputs
2012
(In millions)
(Level 1) (Level 2) (Level 3) Total
Guaranteed separate accounts (See Note 23) $ 245 $ 324 $ – $ 569
Non-guaranteed separate accounts
(1)
1,925 4,258 1,005 7,188
TOTAL SEPARATE ACCOUNT ASSETS $ 2,170 $ 4,582 $ 1,005 $ 7,757
(1) As of December 31, 2012, non-guaranteed separate accounts included $3.4 billion in assets supporting the Company’s pension plans, including $956 million classified in Level 3.
Separate account assets in Level 1 primarily include exchange-listed actively-traded institutional and retail mutual fund investments and
equity securities. Level 2 assets primarily include: separate accounts priced using the daily net asset value that is the
exit price.
corporate and structured bonds valued using recent trades of similar
securities or pricing models that discount future cash flows at Separate account assets classified in Level 3 include investments
estimated market interest rates as described above; and primarily in securities partnerships, real estate and hedge funds
generally valued based on the separate account’s ownership share of
the equity of the investee including changes in the fair values of its
underlying investments.
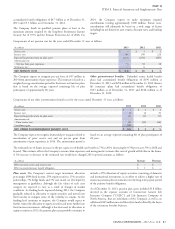
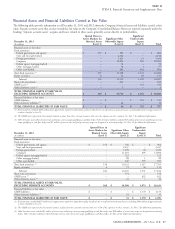
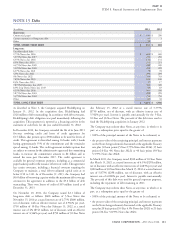
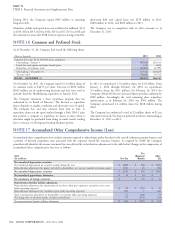
The following table summarizes the change in separate account assets reported in Level 3 for the years ended December 31, 2013 and 2012.
(In millions)
2013 2012
Balance at January 1 $ 1,005 $ 750
Policyholder gains
(1)
82 55
Purchases, issuances, settlements:
Purchases 173 283
Sales (14) (6)
Settlements (209) (90)
Total purchases, sales and settlements (50) 187
Transfers into/(out of ) Level 3:
Transfers into Level 3 517
Transfers out of Level 3 (7) (4)
Total transfers into/(out of) Level 3: (2) 13
Balance at December 31 $ 1,035 $ 1,005
(1) Included in this amount were gains of $76 million attributable to instruments still held at December 31, 2013 and gains of $49 million attributable to instruments still held at
December 31, 2012.
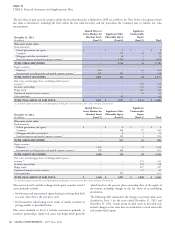
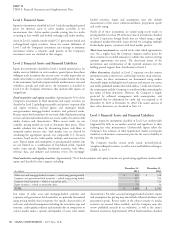
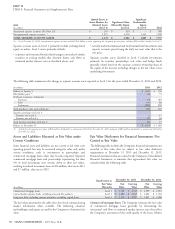
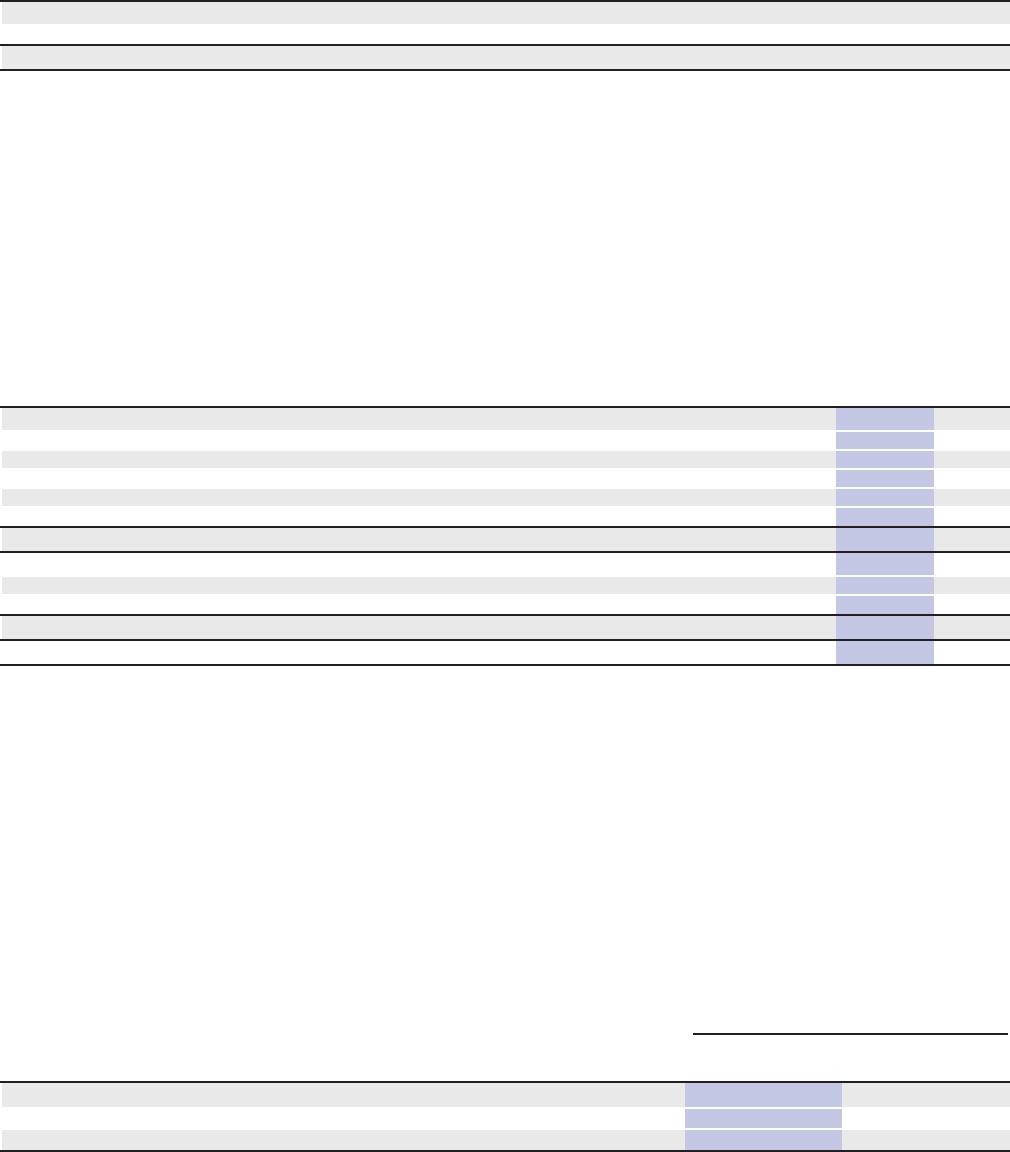
Assets and Liabilities Measured at Fair Value under Fair Value Disclosures for Financial Instruments Not
Certain Conditions Carried at Fair Value
Some financial assets and liabilities are not carried at fair value each The following table includes the Company’s financial instruments not
reporting period, but may be measured using fair value only under recorded at fair value that are subject to fair value disclosure
certain conditions, such as investments in partnerships and requirements at December 31, 2013 and December 31, 2012.
commercial mortgage loans when they become impaired. Impaired Financial instruments that are carried in the Company’s Consolidated
commercial mortgage loans and partnerships representing less than Financial Statements at amounts that approximate fair value are
1% of total investments were written down to their fair values, excluded from the following table.
resulting in realized investment losses of $12 million, after-tax in 2013
and $7 million, after-tax in 2012.
December 31, 2013 December 31, 2012
Classification in
Fair Value Fair Carrying Fair Carrying
(In millions)
Hierarchy Value Value Value Value
Commercial mortgage loans Level 3 $ 2,338 $ 2,252 $ 2,999 $ 2,851
Contractholder deposit funds, excluding universal life products Level 3 $ 1,081 $ 1,072 $ 1,082 $ 1,056
Long-term debt, including current maturities, excluding capital leases Level 2 $ 5,550 $ 4,997 $ 5,821 $ 4,986
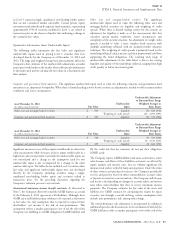
The fair values presented in the table above have been estimated using Commercial mortgage loans. The Company estimates the fair value
market information when available. The following valuation of commercial mortgage loans generally by discounting the
methodologies and inputs are used by the Company to determine fair contractual cash flows at estimated market interest rates that reflect
value. the Company’s assessment of the credit quality of the loans. Market
92 CIGNA CORPORATION - 2013 Form 10-K
•
•