Cigna 2013 Annual Report Download - page 86
Download and view the complete annual report
Please find page 86 of the 2013 Cigna annual report below. You can navigate through the pages in the report by either clicking on the pages listed below, or by using the keyword search tool below to find specific information within the annual report.-
 1
1 -
2
-
3
-
4
-
5
-
6
-
7
-
8
-
9
-
10
-
11
-
12
-
13
-
14
-
15
-
16
-
17
-
18
-
19
-
20
-
21
-
22
-
23
-
24
-
25
-
26
-
27
-
28
-
29
-
30
-
31
-
32
-
33
-
34
-
35
-
36
-
37
-
38
-
39
-
40
-
41
-
42
-
43
-
44
-
45
-
46
-
47
-
48
-
49
-
50
-
51
-
52
-
53
-
54
-
55
-
56
-
57
-
58
-
59
-
60
-
61
-
62
-
63
-
64
-
65
-
66
-
67
-
68
-
69
-
70
-
71
-
72
-
73
-
74
-
75
-
 76
76 -
 77
77 -
 78
78 -
 79
79 -
 80
80 -
 81
81 -
 82
82 -
 83
83 -
 84
84 -
 85
85 -
 86
86 -
 87
87 -
 88
88 -
 89
89 -
 90
90 -
 91
91 -
 92
92 -
 93
93 -
 94
94 -
 95
95 -
 96
96 -
97
-
98
-
99
-
100
-
101
-
102
-
103
-
104
-
105
-
106
-
107
-
108
-
109
-
110
-
111
-
112
-
113
-
114
-
115
-
116
-
117
-
118
-
119
-
120
-
121
-
122
-
123
-
124
-
125
-
126
-
127
-
128
-
129
-
130
-
131
-
132
-
133
-
134
-
135
-
136
-
137
-
138
-
139
-
140
-
141
-
142
-
143
-
144
-
145
-
146
-
147
-
148
-
149
-
150
-
151
-
152
-
153
-
154
-
155
-
156
-
157
-
158
-
159
-
160
-
161
-
162
-
163
-
164
-
165
-
166
-
167
-
168
-
169
-
170
-
171
-
172
-
173
-
174
-
175
-
176
-
177
-
178
-
179
-
180
-
181
-
182
 |
 |
PART II
ITEM 7. Management’s Discussion and Analysis of Financial Condition and Results of Operations
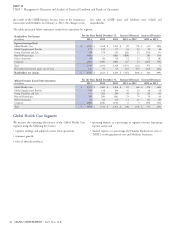
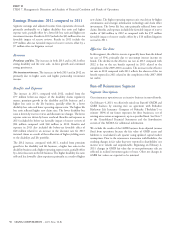
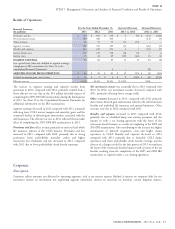
intersegment eliminations, compensation cost for stock options, expense associated with our frozen pension plans and certain overhead and
project costs.
For the Years Ended December 31, Increase/(Decrease) Increase/(Decrease)
Financial Summary
(In millions) 2013 2012 2011 2013 vs. 2012 2012 vs. 2011
Segment loss $(222) $(329) $(184) $ 107 33% $ (145) (79)%
Less: special items (after-tax) included in segment loss:
Cost associated with HealthSpring acquisition (See Note 3
to the Consolidated Financial Statements) (33) (28) 33 (5)
Charges related to litigation matters (See Note 23 to the
Consolidated Financial Statements) (68) 68 (68)
Completion of IRS examination (See Note 19 to the
Consolidated Financial Statements) 14 – (14)
ADJUSTED LOSS FROM OPERATIONS $(222) $(228) $(170) $ 6 3% $ (58) (34)%
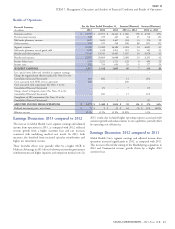
The decrease in Corporate’s segment loss in 2013, compared with In 2012, segment loss for Corporate was significantly higher than in
2012, is primarily attributable to the absence of special item costs 2011, primarily reflecting higher interest expense due to the
associated with both litigation matters and the HealthSpring $2.1 billion of long-term debt issued in the fourth quarter of 2011 to
acquisition in 2012. fund the HealthSpring acquisition, and costs associated with litigation
matters.
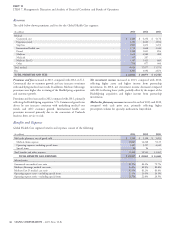
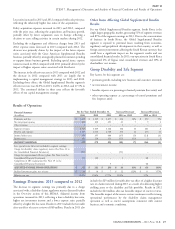
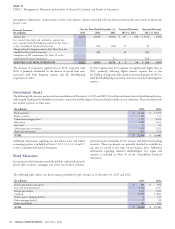
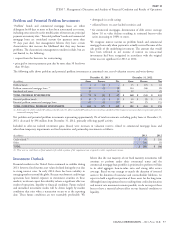
The following table presents our invested asset portfolio as of December 31, 2013 and 2012. Overall invested assets have declined during the year,
reflecting the funding of the Berkshire reinsurance transaction and the impact of increased market yields on asset valuations. These investments do
not include separate account assets.
(In millions) 2013 2012
Fixed maturities $ 16,486 $ 17,705
Equity securities 141 111
Commercial mortgage loans 2,252 2,851
Policy loans 1,485 1,501
Real estate 97 83
Other long-term investments 1,273 1,255
Short-term investments 631 154
TOTAL $ 22,365 $ 23,660
Additional information regarding our investment assets and related preferred stocks redeemable by the investor and hybrid and trading
accounting policies is included in Notes 2, 10, 11, 12, 13, 14 and 17 securities. These investments are generally classified as available for
to the Consolidated Financial Statements. sale and are carried at fair value on our balance sheet. Additional
information regarding valuation methodologies, key inputs and
controls is included in Note 10 of the Consolidated Financial
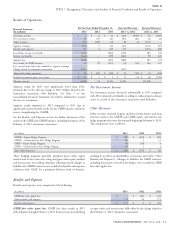
Fixed Maturities
Statements.
Investments in fixed maturities include publicly traded and privately
placed debt securities, mortgage and other asset-backed securities,
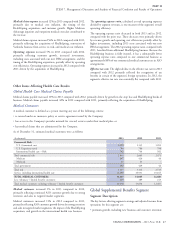
The following table reflects our fixed maturity portfolio by type of issuer as of December 31, 2013 and 2012.
(In millions) 2013 2012
Federal government and agency $ 880 $ 902
State and local government 2,144 2,437
Foreign government 1,444 1,322
Corporate 10,981 11,896
Federal agency mortgage-backed 76 122
Other mortgage-backed 77 89
Other asset-backed 884 937
TOTAL $ 16,486 $ 17,705
54 CIGNA CORPORATION - 2013 Form 10-K
Investment Assets