Cigna 2013 Annual Report Download - page 82
Download and view the complete annual report
Please find page 82 of the 2013 Cigna annual report below. You can navigate through the pages in the report by either clicking on the pages listed below, or by using the keyword search tool below to find specific information within the annual report.-
 1
1 -
2
-
3
-
4
-
5
-
6
-
7
-
8
-
9
-
10
-
11
-
12
-
13
-
14
-
15
-
16
-
17
-
18
-
19
-
20
-
21
-
22
-
23
-
24
-
25
-
26
-
27
-
28
-
29
-
30
-
31
-
32
-
33
-
34
-
35
-
36
-
37
-
38
-
39
-
40
-
41
-
42
-
43
-
44
-
45
-
46
-
47
-
48
-
49
-
50
-
51
-
52
-
53
-
54
-
55
-
56
-
57
-
58
-
59
-
60
-
61
-
62
-
63
-
64
-
65
-
66
-
67
-
68
-
69
-
70
-
71
-
 72
72 -
 73
73 -
 74
74 -
 75
75 -
 76
76 -
 77
77 -
 78
78 -
 79
79 -
 80
80 -
 81
81 -
 82
82 -
 83
83 -
 84
84 -
 85
85 -
 86
86 -
 87
87 -
 88
88 -
 89
89 -
 90
90 -
 91
91 -
 92
92 -
93
-
94
-
95
-
96
-
97
-
98
-
99
-
100
-
101
-
102
-
103
-
104
-
105
-
106
-
107
-
108
-
109
-
110
-
111
-
112
-
113
-
114
-
115
-
116
-
117
-
118
-
119
-
120
-
121
-
122
-
123
-
124
-
125
-
126
-
127
-
128
-
129
-
130
-
131
-
132
-
133
-
134
-
135
-
136
-
137
-
138
-
139
-
140
-
141
-
142
-
143
-
144
-
145
-
146
-
147
-
148
-
149
-
150
-
151
-
152
-
153
-
154
-
155
-
156
-
157
-
158
-
159
-
160
-
161
-
162
-
163
-
164
-
165
-
166
-
167
-
168
-
169
-
170
-
171
-
172
-
173
-
174
-
175
-
176
-
177
-
178
-
179
-
180
-
181
-
182
 |
 |
PART II
ITEM 7. Management’s Discussion and Analysis of Financial Condition and Results of Operations
new claims. The higher operating expense ratio was driven by higher
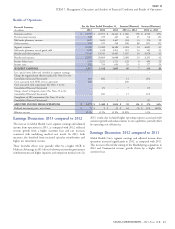
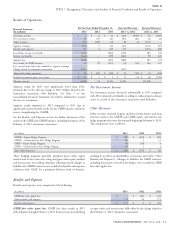
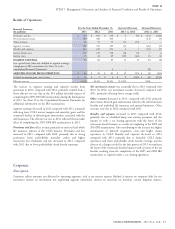
Earnings Discussion: 2012 compared to 2011
commissions and strategic information technology and claim office
Segment earnings and adjusted income from operations decreased, investments. The lower life loss ratio primarily reflected lower new
primarily attributable to a higher disability loss ratio and higher claims. Benefits and expenses included the favorable impact of reserve
expense ratio, partially offset by a lower life loss ratio and higher net studies of $60 million in 2012 as compared with the $59 million
investment income. Results in 2012 include the $43 million after-tax favorable impact of reserve studies offset by a $10 million litigation
favorable impact of reserve reviews. Results in 2011 include the accrual in 2011.
$39 million after-tax favorable impact of reserve reviews offset by a
$7 million after-tax litigation accrual.
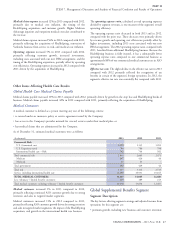
Effective Tax Rate
In this segment, the effective tax rate is generally lower than the federal
Revenues
tax rate of 35%, primarily due to tax-exempt interest income on
Premiums and fees. The increases in both 2013 and in 2012 reflect bonds. The decline in the effective tax rate in 2013 compared with
strong disability and life new sales, in-force growth and continued 2012 is due to the tax benefit reported in 2013 related to the
strong persistency. completion of the 2009-2010 tax audits. The increase in the effective
tax rate in 2012 compared with 2011 reflects the absence of the tax
Net investment income. The increases in both 2013 and in 2012 are benefit reported in 2011 related to the completion of the 2007-2008
primarily due to higher assets and higher partnership investment tax audits.
income.
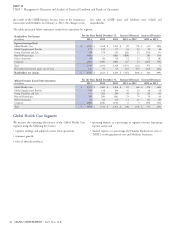
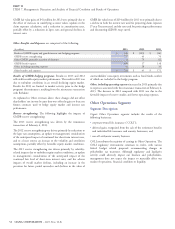
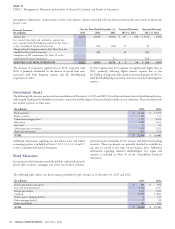
Run-off Reinsurance Segment
Benefits and Expenses
Segment Description
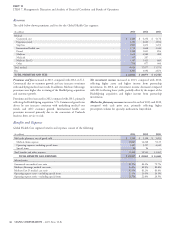
The increase in 2013, compared with 2012, resulted from the
$77 million before-tax impact of the disability claims regulatory Our reinsurance operations are an inactive business in run-off mode.
matter, premium growth in the disability and life business and a On February 4, 2013, we effectively exited our Run-off GMDB and
higher loss ratio in the life business, partially offset by a lower GMIB business by entering into an agreement with Berkshire
disability loss ratio and lower operating expense ratio. The higher life Hathaway Life Insurance Company of Nebraska (‘‘Berkshire’’) to
loss ratio reflected higher new claim sizes. The lower disability loss reinsure 100% of our future exposures for these businesses, net of
ratio is driven by reserve reviews and discount rate changes. The lower existing retrocession arrangements, up to a specified limit. See Note 7
expense ratio was driven by lower overhead. Benefits and expenses in to the Consolidated Financial Statements and the Introduction
2013 included the before-tax favorable impact of reserve reviews of section of this MD&A for additional information.
$84 million compared with $60 million in 2012. Benefits and
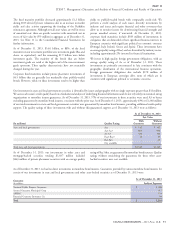
expenses in 2013 also included the before-tax favorable effect of We exclude the results of the GMIB business from adjusted income
$40 million related to an increase in the discount rate for 2013 (loss) from operations because the fair value of GMIB assets and
incurred claims as a result of the reallocation of higher yielding assets liabilities is recalculated each quarter using updated capital market
to the disability and life portfolio. assumptions. Prior to the reinsurance transaction with Berkshire, the
resulting changes in fair value that were reported in shareholders’ net
The 2012 increase, compared with 2011, resulted from premium income were volatile and unpredictable. Beginning on February 4,
growth in the disability and life business, a higher loss ratio in the 2013, changes in GMIB fair value due to non-performance risk are
disability business and a higher operating expense ratio, partially offset reflected in realized investment gains or losses. Other net changes in
by a lower loss ratio in the life business. The higher disability loss ratio GMIB fair values are expected to be minimal.
reflected less favorable claim experience primarily as a result of higher
50 CIGNA CORPORATION - 2013 Form 10-K