Cigna 2013 Annual Report Download - page 107
Download and view the complete annual report
Please find page 107 of the 2013 Cigna annual report below. You can navigate through the pages in the report by either clicking on the pages listed below, or by using the keyword search tool below to find specific information within the annual report.-
 1
1 -
2
-
3
-
4
-
5
-
6
-
7
-
8
-
9
-
10
-
11
-
12
-
13
-
14
-
15
-
16
-
17
-
18
-
19
-
20
-
21
-
22
-
23
-
24
-
25
-
26
-
27
-
28
-
29
-
30
-
31
-
32
-
33
-
34
-
35
-
36
-
37
-
38
-
39
-
40
-
41
-
42
-
43
-
44
-
45
-
46
-
47
-
48
-
49
-
50
-
51
-
52
-
53
-
54
-
55
-
56
-
57
-
58
-
59
-
60
-
61
-
62
-
63
-
64
-
65
-
66
-
67
-
68
-
69
-
70
-
71
-
72
-
73
-
74
-
75
-
76
-
77
-
78
-
79
-
80
-
81
-
82
-
83
-
84
-
85
-
86
-
87
-
88
-
89
-
90
-
91
-
92
-
93
-
94
-
95
-
96
-
 97
97 -
 98
98 -
 99
99 -
 100
100 -
 101
101 -
 102
102 -
 103
103 -
 104
104 -
 105
105 -
 106
106 -
 107
107 -
 108
108 -
 109
109 -
 110
110 -
 111
111 -
 112
112 -
 113
113 -
 114
114 -
 115
115 -
 116
116 -
 117
117 -
118
-
119
-
120
-
121
-
122
-
123
-
124
-
125
-
126
-
127
-
128
-
129
-
130
-
131
-
132
-
133
-
134
-
135
-
136
-
137
-
138
-
139
-
140
-
141
-
142
-
143
-
144
-
145
-
146
-
147
-
148
-
149
-
150
-
151
-
152
-
153
-
154
-
155
-
156
-
157
-
158
-
159
-
160
-
161
-
162
-
163
-
164
-
165
-
166
-
167
-
168
-
169
-
170
-
171
-
172
-
173
-
174
-
175
-
176
-
177
-
178
-
179
-
180
-
181
-
182
 |
 |
PART II
ITEM 8. Financial Statements and Supplementary Data
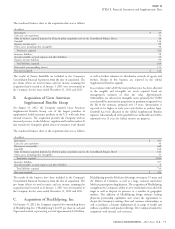
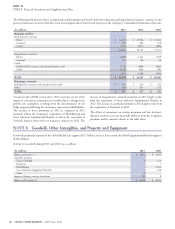
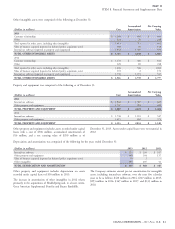
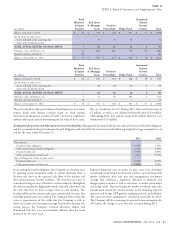
The estimated fair values and useful lives for intangible assets are as follows:
Estimated Estimated Useful Life
(Dollars in millions)
Fair Value (In Years)
Customer relationships $ 711 8
Other 84 3-10
Total other intangible assets $ 795
The fair value of the customer relationship and the amortization The results of HealthSpring have been included in the Company’s
method were determined using an income approach that relies on Consolidated Financial Statements from the date of the acquisition.
projected future net cash flows including key assumptions for the Revenues of HealthSpring included in the Company’s results for the
customer attrition rate and discount rate. The estimated weighted year ended December 31, 2012 were approximately $5.4 billion.
average useful life reflects the time period and front-loaded pattern of During 2012, the Company recorded $53 million pre-tax
expected future cash flows. Amortization is recorded on a basis ($40 million after-tax) of acquisition-related costs in other operating
consistent with that pattern, and as a result amortization expense expenses.
declined in 2013 from 2012, and will continue to decline in
subsequent years. The Company expects more than 50% of the
intangible asset value to be amortized by the end of 2014.
Pro forma information. The following table presents selected unaudited pro forma information for the Company assuming the acquisition of
HealthSpring had occurred as of January 1, 2011. This pro forma information does not purport to represent what the Company’s actual results
would have been if the acquisition had occurred as of the date indicated or what such results would be for any future periods.
Year Ended December 31,
(In millions, except per share amounts)
2012 2011
Total revenues $ 29,608 $ 27,461
Shareholders’ net income $ 1,633 $ 1,456
Earnings per share:
Basic $ 5.73 $ 5.11
Diluted $ 5.63 $ 5.02
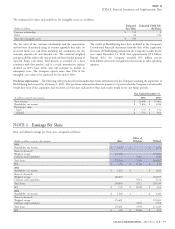
Earnings Per Share
Basic and diluted earnings per share were computed as follows:
Effect of
(Dollars in millions, except per share amounts)
Basic Dilution Diluted
2013
Shareholders’ net income $ 1,476 $ - $ 1,476
Shares(in thousands):
Weighted average 279,296 - 279,296
Common stock equivalents 5,389 5,389
Total shares 279,296 5,389 284,685
EPS $ 5.28 $ (0.10) $ 5.18
2012
Shareholders’ net income $ 1,623 $ - $ 1,623
Shares(in thousands):
Weighted average 284,819 - 284,819
Common stock equivalents 4,711 4,711
Total shares 284,819 4,711 289,530
EPS $ 5.70 $ (0.09) $ 5.61
2011
Shareholders’ net income $ 1,260 $ - $ 1,260
Shares(in thousands):
Weighted average 270,691 - 270,691
Common stock equivalents 3,558 3,558
Total shares 270,691 3,558 274,249
EPS $ 4.65 $ (0.06) $ 4.59
CIGNA CORPORATION - 2013 Form 10-K 75
NOTE 4