Cigna 2013 Annual Report Download - page 62
Download and view the complete annual report
Please find page 62 of the 2013 Cigna annual report below. You can navigate through the pages in the report by either clicking on the pages listed below, or by using the keyword search tool below to find specific information within the annual report.-
 1
1 -
2
-
3
-
4
-
5
-
6
-
7
-
8
-
9
-
10
-
11
-
12
-
13
-
14
-
15
-
16
-
17
-
18
-
19
-
20
-
21
-
22
-
23
-
24
-
25
-
26
-
27
-
28
-
29
-
30
-
31
-
32
-
33
-
34
-
35
-
36
-
37
-
38
-
39
-
40
-
41
-
42
-
43
-
44
-
45
-
46
-
47
-
48
-
49
-
50
-
51
-
 52
52 -
 53
53 -
 54
54 -
 55
55 -
 56
56 -
 57
57 -
 58
58 -
 59
59 -
 60
60 -
 61
61 -
 62
62 -
 63
63 -
 64
64 -
 65
65 -
 66
66 -
 67
67 -
 68
68 -
 69
69 -
 70
70 -
 71
71 -
 72
72 -
73
-
74
-
75
-
76
-
77
-
78
-
79
-
80
-
81
-
82
-
83
-
84
-
85
-
86
-
87
-
88
-
89
-
90
-
91
-
92
-
93
-
94
-
95
-
96
-
97
-
98
-
99
-
100
-
101
-
102
-
103
-
104
-
105
-
106
-
107
-
108
-
109
-
110
-
111
-
112
-
113
-
114
-
115
-
116
-
117
-
118
-
119
-
120
-
121
-
122
-
123
-
124
-
125
-
126
-
127
-
128
-
129
-
130
-
131
-
132
-
133
-
134
-
135
-
136
-
137
-
138
-
139
-
140
-
141
-
142
-
143
-
144
-
145
-
146
-
147
-
148
-
149
-
150
-
151
-
152
-
153
-
154
-
155
-
156
-
157
-
158
-
159
-
160
-
161
-
162
-
163
-
164
-
165
-
166
-
167
-
168
-
169
-
170
-
171
-
172
-
173
-
174
-
175
-
176
-
177
-
178
-
179
-
180
-
181
-
182
 |
 |

PART II
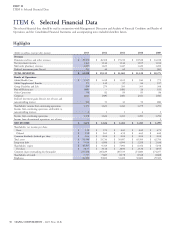
ITEM 6. Selected Financial Data
Selected Financial Data
The selected financial data should be read in conjunction with Management’s Discussion and Analysis of Financial Condition and Results of
Operations and the Consolidated Financial Statements and accompanying notes included elsewhere herein.
Highlights
(Dollars in millions, except per share amounts)
2013 2012 2011 2010 2009
Revenues
Premiums and fees and other revenues $ 29,176 $ 26,308 $ 19,210 $ 18,528 $ 16,018
Net investment income 1,164 1,144 1,146 1,105 1,014
Mail order pharmacy revenues 1,827 1,623 1,447 1,420 1,282
Realized investment gains (losses) 213 44 62 75 (43)
TOTAL REVENUES $ 32,380 $ 29,119 $ 21,865 $ 21,128 $ 18,271
Results of Operations:
Global Health Care $ 1,517 $ 1,418 $ 1,105 $ 940 $ 775
Global Supplemental Benefits 175 142 97 84 107
Group Disability and Life 259 279 295 305 306
Run-off Reinsurance (488) – (183) 26 185
Other Operations 94 82 89 85 86
Corporate (222) (329) (184) (211) (142)
Realized investment gains (losses), net of taxes and
noncontrolling interest 141 31 41 50 (26)
Shareholders’ income from continuing operations 1,476 1,623 1,260 1,279 1,291
Income from continuing operations attributable to
noncontrolling interests 21143
Income from continuing operations 1,478 1,624 1,261 1,283 1,294
Income from discontinued operations, net of taxes ––––1
NET INCOME $ 1,478 $ 1,624 $ 1,261 $ 1,283 $ 1,295
Shareholders’ net income per share:
Basic $ 5.28 $ 5.70 $ 4.65 $ 4.69 $ 4.71
Diluted $ 5.18 $ 5.61 $ 4.59 $ 4.65 $ 4.69
Common dividends declared per share $ 0.04 $ 0.04 $ 0.04 $ 0.04 $ 0.04
Total assets $ 54,336 $ 53,734 $ 50,697 $ 45,393 $ 42,794
Long-term debt $ 5,014 $ 4,986 $ 4,990 $ 2,288 $ 2,436
Shareholders’ equity $ 10,567 $ 9,769 $ 7,994 $ 6,356 $ 5,198
Per share $ 38.35 $ 34.18 $ 28.00 $ 23.38 $ 18.95
Common shares outstanding (in thousands) 275,526 285,829 285,533 271,880 274,257
Shareholders of record 7,535 7,885 8,178 8,568 8,888
Employees 36,500 35,800 31,400 30,600 29,300
30 CIGNA CORPORATION - 2013 Form 10-K
ITEM 6.