Cigna 2013 Annual Report Download - page 70
Download and view the complete annual report
Please find page 70 of the 2013 Cigna annual report below. You can navigate through the pages in the report by either clicking on the pages listed below, or by using the keyword search tool below to find specific information within the annual report.-
 1
1 -
2
-
3
-
4
-
5
-
6
-
7
-
8
-
9
-
10
-
11
-
12
-
13
-
14
-
15
-
16
-
17
-
18
-
19
-
20
-
21
-
22
-
23
-
24
-
25
-
26
-
27
-
28
-
29
-
30
-
31
-
32
-
33
-
34
-
35
-
36
-
37
-
38
-
39
-
40
-
41
-
42
-
43
-
44
-
45
-
46
-
47
-
48
-
49
-
50
-
51
-
52
-
53
-
54
-
55
-
56
-
57
-
58
-
59
-
 60
60 -
 61
61 -
 62
62 -
 63
63 -
 64
64 -
 65
65 -
 66
66 -
 67
67 -
 68
68 -
 69
69 -
 70
70 -
 71
71 -
 72
72 -
 73
73 -
 74
74 -
 75
75 -
 76
76 -
 77
77 -
 78
78 -
 79
79 -
 80
80 -
81
-
82
-
83
-
84
-
85
-
86
-
87
-
88
-
89
-
90
-
91
-
92
-
93
-
94
-
95
-
96
-
97
-
98
-
99
-
100
-
101
-
102
-
103
-
104
-
105
-
106
-
107
-
108
-
109
-
110
-
111
-
112
-
113
-
114
-
115
-
116
-
117
-
118
-
119
-
120
-
121
-
122
-
123
-
124
-
125
-
126
-
127
-
128
-
129
-
130
-
131
-
132
-
133
-
134
-
135
-
136
-
137
-
138
-
139
-
140
-
141
-
142
-
143
-
144
-
145
-
146
-
147
-
148
-
149
-
150
-
151
-
152
-
153
-
154
-
155
-
156
-
157
-
158
-
159
-
160
-
161
-
162
-
163
-
164
-
165
-
166
-
167
-
168
-
169
-
170
-
171
-
172
-
173
-
174
-
175
-
176
-
177
-
178
-
179
-
180
-
181
-
182
 |
 |

PART II
ITEM 7. Management’s Discussion and Analysis of Financial Condition and Results of Operations
Interest Expense
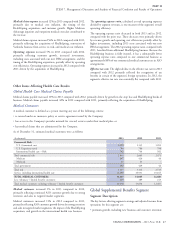
Interest expense on long-term debt, short-term debt and capital leases was as follows:
(In millions)
2013 2012 2011
Interest expense $ 270 $ 268 $ 202
The increase in interest expense in 2012 was primarily due to the could affect our ability to access those markets for additional
issuance of $2.1 billion of long-term debt in the fourth quarter of borrowings or increase costs associated with borrowing funds.
2011 to fund the acquisition of HealthSpring, partially offset by a We maintain a capital management strategy to indefinitely reinvest
lower weighted average interest rate reflecting the more favorable rates the earnings of certain of our foreign operations overseas. Indefinitely
of this debt issued. The weighted average interest rate for outstanding reinvested earnings are generally deployed in these countries, and
short-term debt (primarily commercial paper) was 0.41% at other foreign jurisdictions in support of the liquidity and capital needs
December 31, 2013 and .47% at 2012. of our foreign operations, where possible. As of December 31, 2013
indefinitely reinvested earnings were approximately $1.1 billion.
Liquidity and Capital Resources Outlook
Approximately $176 million of cash and cash equivalents held in these
countries would, if repatriated, be subject to a charge representing the
At December 31, 2013, there was approximately $760 million in cash difference between the U.S. and foreign tax rates. This strategy does
and short-term investments available at the parent company level. In not materially limit our ability to meet our liquidity and capital needs
2014, the parent company’s combined cash obligations are expected in the United States. Cash and cash equivalents in foreign operations
to be approximately $480 million for commercial paper maturities, are held primarily to meet local liquidity and surplus needs with excess
interest and pension contributions. funds generally invested in longer duration high quality securities.
We expect, based on the parent company’s current cash position, Unfunded Pension Plan Liability. As of December 31, 2013, our
current projections for subsidiary dividends, and the ability to unfunded pension liability was $611 million, a decrease of
refinance its commercial paper borrowing, to have sufficient liquidity approximately $1.0 billion from December 31, 2012, reflecting an
to meet the obligations discussed above. increase in the assumed discount rate of 100 basis points, strong asset
However, our cash projections may not be realized and the demand returns, and pension contributions of $195 million in 2013. We
for funds could exceed available cash if our ongoing businesses expect to make pension contributions in 2014 required under the
experience unexpected shortfalls in earnings, or we experience Pension Protection Act of 2006 of approximately $100 million. As a
material adverse effects from one or more risks or uncertainties result of the improved funding position, we do not expect to make
described more fully in the Risk Factors section of this Form 10-K. In voluntary contributions in 2014. In addition, during 2013, we
those cases, we expect to have the flexibility to satisfy liquidity needs increased our asset allocation to fixed income investments and
through a variety of measures, including intercompany borrowings reduced our allocation to domestic stocks in order to reduce the
and sales of liquid investments. The parent company may borrow up investment risk in the pension plan.
to $1.2 billion from its insurance subsidiaries without prior state
Solvency II. Our businesses in the European Union will be subject
approval. As of December 31, 2013, the parent company had no net
to the directive on insurance regulation, solvency and governance
intercompany loan balance with its insurance subsidiaries.
requirements known as Solvency II. This directive will impose
Alternatively, to satisfy parent company liquidity requirements we
economic risk-based solvency and governance requirements and
may use short-term borrowings, such as the commercial paper
supervisory rules and becomes effective in 2016, although certain EU
program, the committed revolving credit and letter of credit
country regulators are requiring companies to demonstrate technical
agreement of up to $1.5 billion subject to the maximum debt leverage
capability and comply with increased capital levels in advance of their
covenant in its line of credit agreement. As of December 31, 2013, we
effective date. Our European insurance companies are capitalized at
had $1.5 billion of borrowing capacity under the credit agreement.
levels consistent with projected Solvency II requirements and in
Within the maximum debt leverage covenant in the line of credit
compliance with anticipated governance and technical capability
agreement, we have an additional $6.0 billion of borrowing capacity
requirements.
in addition to the $5.2 billion of debt outstanding.
Though we believe we have adequate sources of liquidity, continued
significant disruption or volatility in the capital and credit markets
38 CIGNA CORPORATION - 2013 Form 10-K