Cigna 2013 Annual Report Download - page 116
Download and view the complete annual report
Please find page 116 of the 2013 Cigna annual report below. You can navigate through the pages in the report by either clicking on the pages listed below, or by using the keyword search tool below to find specific information within the annual report.-
 1
1 -
2
-
3
-
4
-
5
-
6
-
7
-
8
-
9
-
10
-
11
-
12
-
13
-
14
-
15
-
16
-
17
-
18
-
19
-
20
-
21
-
22
-
23
-
24
-
25
-
26
-
27
-
28
-
29
-
30
-
31
-
32
-
33
-
34
-
35
-
36
-
37
-
38
-
39
-
40
-
41
-
42
-
43
-
44
-
45
-
46
-
47
-
48
-
49
-
50
-
51
-
52
-
53
-
54
-
55
-
56
-
57
-
58
-
59
-
60
-
61
-
62
-
63
-
64
-
65
-
66
-
67
-
68
-
69
-
70
-
71
-
72
-
73
-
74
-
75
-
76
-
77
-
78
-
79
-
80
-
81
-
82
-
83
-
84
-
85
-
86
-
87
-
88
-
89
-
90
-
91
-
92
-
93
-
94
-
95
-
96
-
97
-
98
-
99
-
100
-
101
-
102
-
103
-
104
-
105
-
 106
106 -
 107
107 -
 108
108 -
 109
109 -
 110
110 -
 111
111 -
 112
112 -
 113
113 -
 114
114 -
 115
115 -
 116
116 -
 117
117 -
 118
118 -
 119
119 -
 120
120 -
 121
121 -
 122
122 -
 123
123 -
 124
124 -
 125
125 -
 126
126 -
127
-
128
-
129
-
130
-
131
-
132
-
133
-
134
-
135
-
136
-
137
-
138
-
139
-
140
-
141
-
142
-
143
-
144
-
145
-
146
-
147
-
148
-
149
-
150
-
151
-
152
-
153
-
154
-
155
-
156
-
157
-
158
-
159
-
160
-
161
-
162
-
163
-
164
-
165
-
166
-
167
-
168
-
169
-
170
-
171
-
172
-
173
-
174
-
175
-
176
-
177
-
178
-
179
-
180
-
181
-
182
 |
 |
PART II
ITEM 8. Financial Statements and Supplementary Data
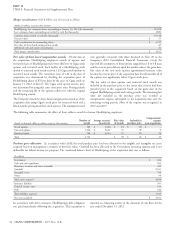
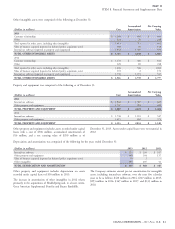
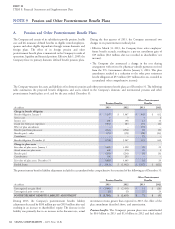
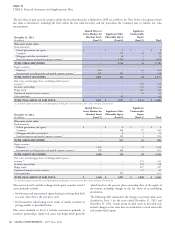
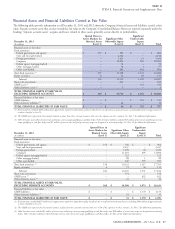
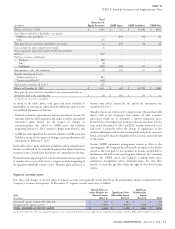
The fair values of plan assets by category and by the fair value hierarchy as defined by GAAP are as follows. See Note 10 for a description of how
fair value is determined, including the level within the fair value hierarchy and the procedures the Company uses to validate fair value
measurements.
Quoted Prices in Significant
Active Markets for Significant Other Unobservable
Identical Assets Observable Inputs Inputs
December 31, 2013
(In millions)
(Level 1) (Level 2) (Level 3) Total
Plan assets at fair value:
Fixed maturities:
Federal government and agency $ – $ 2 $ – $ 2
Corporate – 725 24 749
Mortgage and other asset-backed – 18 5 23
Fund investments and pooled separate accounts
(1)
– 1,019 3 1,022
TOTAL FIXED MATURITIES – 1,764 32 1,796
Equity securities:
Domestic 824 – 35 859
International, including funds and pooled separate accounts
(1)
187 124 7 318
TOTAL EQUITY SECURITIES 1,011 124 42 1,177
Real estate and mortgage loans, including pooled separate
accounts
(1)
– – 339 339
Securities partnerships – – 304 304
Hedge funds – – 360 360
Guaranteed deposit account contract – – 44 44
Cash equivalents – 69 – 69
TOTAL PLAN ASSETS AT FAIR VALUE $ 1,011 $ 1,957 $ 1,121 $ 4,089
(1) A pooled separate account has several participating benefit plans and each owns a share of the total pool of investments.
Quoted Prices in Significant
Active Markets for Significant Other Unobservable
Identical Assets Observable Inputs Inputs
December 31, 2012
(In millions)
(Level 1) (Level 2) (Level 3) Total
Plan assets at fair value:
Fixed maturities:
Federal government and agency $ – $ 4 $ – $ 4
Corporate – 416 27 443
Mortgage and other asset-backed – 8 5 13
Fund investments and pooled separate accounts
(1)
– 519 3 522
TOTAL FIXED MATURITIES – 947 35 982
Equity securities:
Domestic 1,202 4 10 1,216
International, including funds and pooled separate accounts
(1)
158 149 – 307
TOTAL EQUITY SECURITIES 1,360 153 10 1,523
Real estate and mortgage loans, including pooled separate
accounts
(1)
– – 351 351
Securities partnerships – – 328 328
Hedge funds – – 327 327
Guaranteed deposit account contract – – 47 47
Cash equivalents – 107 – 107
TOTAL PLAN ASSETS AT FAIR VALUE $ 1,360 $ 1,207 $ 1,098 $ 3,665
(1) A pooled separate account has several participating benefit plans and each owns a share of the total pool of investments.
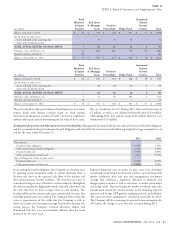
Plan assets in Level 1 include exchange-listed equity securities. Level 2 valued based on the pension plan’s ownership share of the equity of
assets primarily include: the investee including changes in the fair values of its underlying
investments.
fixed income and international equity funds priced using their daily
net asset value that is the exit price; and The following table summarizes the changes in pension plan assets
classified in Level 3 for the years ended December 31, 2013 and
fixed maturities valued using recent trades of similar securities or December 31, 2012. Actual return on plan assets in this table may
pricing models as described below. include changes in fair value that are attributable to both observable
Plan assets classified in Level 3 include investments primarily in and unobservable inputs.
securities partnerships, equity real estate and hedge funds generally
84 CIGNA CORPORATION - 2013 Form 10-K
•
•