Cigna 2013 Annual Report Download - page 141
Download and view the complete annual report
Please find page 141 of the 2013 Cigna annual report below. You can navigate through the pages in the report by either clicking on the pages listed below, or by using the keyword search tool below to find specific information within the annual report.-
 1
1 -
2
-
3
-
4
-
5
-
6
-
7
-
8
-
9
-
10
-
11
-
12
-
13
-
14
-
15
-
16
-
17
-
18
-
19
-
20
-
21
-
22
-
23
-
24
-
25
-
26
-
27
-
28
-
29
-
30
-
31
-
32
-
33
-
34
-
35
-
36
-
37
-
38
-
39
-
40
-
41
-
42
-
43
-
44
-
45
-
46
-
47
-
48
-
49
-
50
-
51
-
52
-
53
-
54
-
55
-
56
-
57
-
58
-
59
-
60
-
61
-
62
-
63
-
64
-
65
-
66
-
67
-
68
-
69
-
70
-
71
-
72
-
73
-
74
-
75
-
76
-
77
-
78
-
79
-
80
-
81
-
82
-
83
-
84
-
85
-
86
-
87
-
88
-
89
-
90
-
91
-
92
-
93
-
94
-
95
-
96
-
97
-
98
-
99
-
100
-
101
-
102
-
103
-
104
-
105
-
106
-
107
-
108
-
109
-
110
-
111
-
112
-
113
-
114
-
115
-
116
-
117
-
118
-
119
-
120
-
121
-
122
-
123
-
124
-
125
-
126
-
127
-
128
-
129
-
130
-
 131
131 -
 132
132 -
 133
133 -
 134
134 -
 135
135 -
 136
136 -
 137
137 -
 138
138 -
 139
139 -
 140
140 -
 141
141 -
 142
142 -
 143
143 -
 144
144 -
 145
145 -
 146
146 -
 147
147 -
 148
148 -
 149
149 -
 150
150 -
 151
151 -
152
-
153
-
154
-
155
-
156
-
157
-
158
-
159
-
160
-
161
-
162
-
163
-
164
-
165
-
166
-
167
-
168
-
169
-
170
-
171
-
172
-
173
-
174
-
175
-
176
-
177
-
178
-
179
-
180
-
181
-
182
 |
 |

PART II
ITEM 8. Financial Statements and Supplementary Data
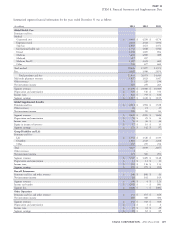
Summarized segment financial information for the years ended December 31 was as follows:
(In millions)
2013 2012 2011
Global Health Care
Premiums and fees:
Medical:
Guaranteed cost $ 4,463 $ 4,256 $ 4,176
Experience-rated 2,292 2,022 1,934
Stop loss 1,907 1,672 1,451
International health care 1,752 1,648 1,344
Dental 1,139 1,005 894
Medicare 5,639 4,969 489
Medicaid 317 207 –
Medicare Part D 1,387 1,421 685
Other 730 677 600
Total medical 19,626 17,877 11,573
Fees 3,307 3,096 2,870
Total premiums and fees 22,933 20,973 14,443
Mail order pharmacy revenues 1,827 1,623 1,447
Other revenues 211 225 236
Net investment income 325 259 263
Segment revenues $ 25,296 $ 23,080 $ 16,389
Depreciation and amortization $ 529 $ 516 $ 314
Income taxes $ 822 $ 793 $ 616
Segment earnings $ 1,517 $ 1,418 $ 1,105
Global Supplemental Benefits
Premiums and fees $ 2,513 $ 1,984 $ 1,528
Other revenues 26 21 15
Net investment income 100 90 83
Segment revenues $ 2,639 $ 2,095 $ 1,626
Depreciation and amortization $ 50 $ 29 $ 14
Income taxes $ 50 $ 36 $ 36
Equity in income of investees $ 17 $ 10 $ 15
Segment earnings $ 175 $ 142 $ 97
Group Disability and Life
Premiums and fees:
Life $ 1,552 $ 1,426 $ 1,333
Disability 1,616 1,413 1,268
Other 257 270 256
Total 3,425 3,109 2,857
Other revenues 1––
Net investment income 321 300 291
Segment revenues $ 3,747 $ 3,409 $ 3,148
Depreciation and amortization $ 14 $ 11 $ 11
Income taxes $ 101 $ 116 $ 113
Segment earnings $ 259 $ 279 $ 295
Run-off Reinsurance
Premiums and fees and other revenues $ (38) $ (98) $ 20
Net investment income 19 102 103
Segment revenues $ (19) $ 4 $ 123
Income tax benefits $ (262) $ – $ (99)
Segment loss $ (488) $ – $ (183)
Other Operations
Premiums and fees and other revenues $ 152 $ 155 $ 169
Net investment income 389 388 400
Segment revenues $ 541 $ 543 $ 569
Depreciation and amortization $1$1$2
Income taxes $ 25 $ 43 $ 29
Segment earnings $ 94 $ 82 $ 89
CIGNA CORPORATION - 2013 Form 10-K 109