Cigna 2013 Annual Report Download - page 117
Download and view the complete annual report
Please find page 117 of the 2013 Cigna annual report below. You can navigate through the pages in the report by either clicking on the pages listed below, or by using the keyword search tool below to find specific information within the annual report.-
 1
1 -
2
-
3
-
4
-
5
-
6
-
7
-
8
-
9
-
10
-
11
-
12
-
13
-
14
-
15
-
16
-
17
-
18
-
19
-
20
-
21
-
22
-
23
-
24
-
25
-
26
-
27
-
28
-
29
-
30
-
31
-
32
-
33
-
34
-
35
-
36
-
37
-
38
-
39
-
40
-
41
-
42
-
43
-
44
-
45
-
46
-
47
-
48
-
49
-
50
-
51
-
52
-
53
-
54
-
55
-
56
-
57
-
58
-
59
-
60
-
61
-
62
-
63
-
64
-
65
-
66
-
67
-
68
-
69
-
70
-
71
-
72
-
73
-
74
-
75
-
76
-
77
-
78
-
79
-
80
-
81
-
82
-
83
-
84
-
85
-
86
-
87
-
88
-
89
-
90
-
91
-
92
-
93
-
94
-
95
-
96
-
97
-
98
-
99
-
100
-
101
-
102
-
103
-
104
-
105
-
106
-
 107
107 -
 108
108 -
 109
109 -
 110
110 -
 111
111 -
 112
112 -
 113
113 -
 114
114 -
 115
115 -
 116
116 -
 117
117 -
 118
118 -
 119
119 -
 120
120 -
 121
121 -
 122
122 -
 123
123 -
 124
124 -
 125
125 -
 126
126 -
 127
127 -
128
-
129
-
130
-
131
-
132
-
133
-
134
-
135
-
136
-
137
-
138
-
139
-
140
-
141
-
142
-
143
-
144
-
145
-
146
-
147
-
148
-
149
-
150
-
151
-
152
-
153
-
154
-
155
-
156
-
157
-
158
-
159
-
160
-
161
-
162
-
163
-
164
-
165
-
166
-
167
-
168
-
169
-
170
-
171
-
172
-
173
-
174
-
175
-
176
-
177
-
178
-
179
-
180
-
181
-
182
 |
 |
PART II
ITEM 8. Financial Statements and Supplementary Data
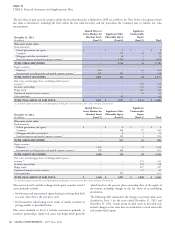
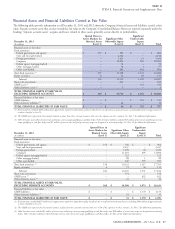
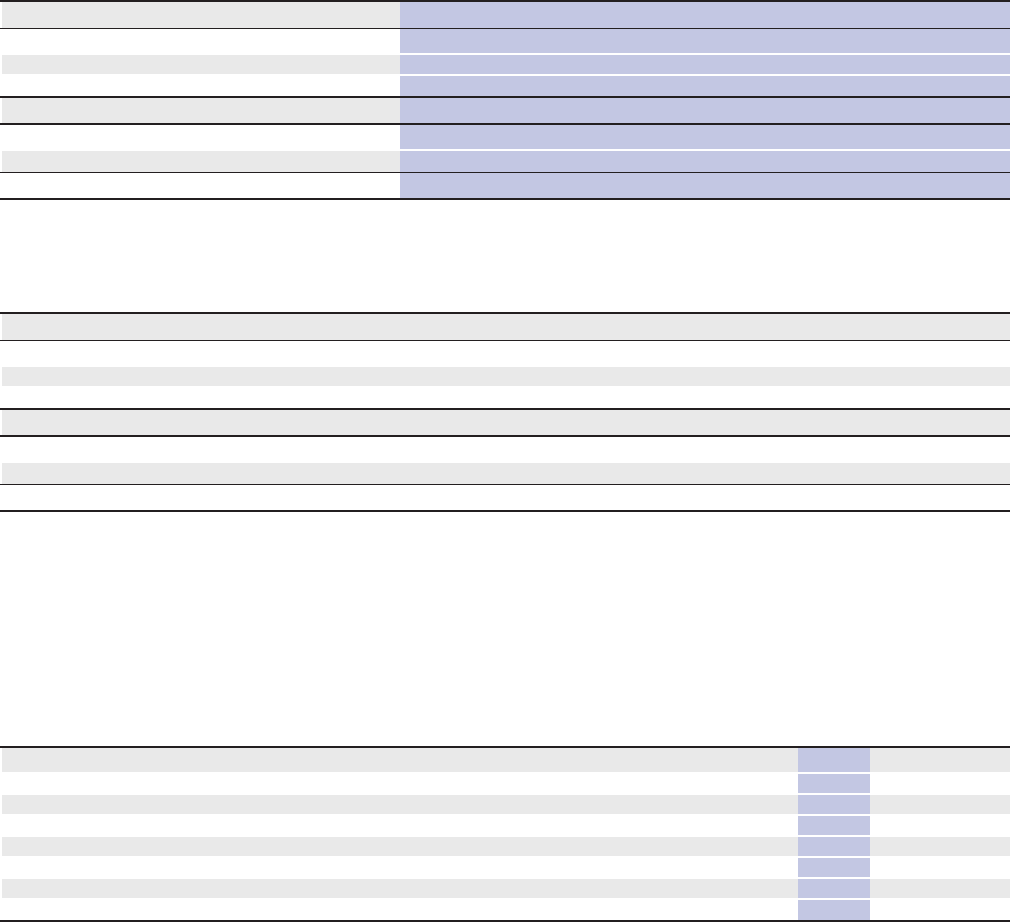
Fixed Guaranteed
Maturities Real Estate Deposit
& Equity & Mortgage Securities Account
(In millions)
Securities Loans Partnerships Hedge Funds Contract Total
Balance at January 1, 2013 $ 44 $ 352 $ 328 $ 327 $ 47 $ 1,098
Actual return on plan assets:
Assets still held at the reporting date – 29 16 38 1 84
Assets sold during the period 7 – – – – 7
TOTAL ACTUAL RETURN ON PLAN ASSETS 7 29 16 38 1 91
Purchases, sales, settlements, net 25 (42) (40) (5) (4) (66)
Transfers into/out of Level 3 (2) – – – – (2)
Balance at December 31, 2013 $ 74 $ 339 $ 304 $ 360 $ 44 $ 1,121
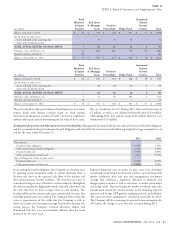
Fixed Guaranteed
Maturities Real Estate Deposit
& Equity & Mortgage Securities Account
(In millions)
Securities Loans Partnerships Hedge Funds Contract Total
Balance at January 1, 2012 $ 26 $ 303 $ 314 $ 148 $ 39 $ 830
Actual return on plan assets:
Assets still held at the reporting date – 38 18 10 3 69
Assets sold during the period – – – – – –
TOTAL ACTUAL RETURN ON PLAN ASSETS – 38 18 10 3 69
Purchases, sales, settlements, net 5 11 (4) 169 5 186
Transfers into/out of Level 3 13 – – – – 13
Balance at December 31, 2012 $ 44 $ 352 $ 328 $ 327 $ 47 $ 1,098
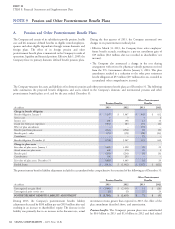
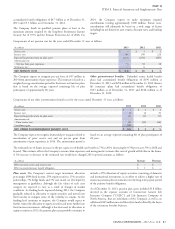
The assets related to other postretirement benefit plans are invested in they are classified as Level 3. During 2013, these assets had a loss of
deposit funds with interest credited based on fixed income $1 million, as well as a net withdrawal from the fund of $3 million,
investments in the general account of CGLIC. As there are significant while during 2012, they earned a return of $1 million, offset by a net
unobservable inputs used in determining the fair value of these assets, withdrawal of $3 million.
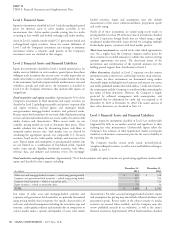
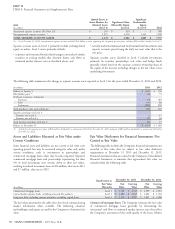
Assumptions for pension and other postretirement benefit plans. Management determined the present value of the projected benefit obligation
and the accumulated other postretirement benefit obligation and related benefit costs based on the following weighted average assumptions as of
and for the years ended December 31:
2013 2012
Discount rate:
Pension benefit obligation 4.50% 3.50%
Other postretirement benefit obligation 4.00% 3.25%
Pension benefit cost 3.50% 4.00%
Other postretirement benefit cost 3.25% 3.75%
Expected long-term return on plan assets:
Pension benefit cost 8.00% 8.00%
Other postretirement benefit cost 5.00% 5.00%
In measuring the benefit obligation, the Company sets discount rates Expected long-term rates of return on plan assets were developed
by applying actual annualized yields at various durations from a considering actual long-term historical returns, expected long-term
discount rate curve to the expected cash flows of the pension and market conditions, plan asset mix and management’s investment
other postretirement benefits liabilities. The discount rate curve is strategy, that continues a significant allocation to domestic and
constructed using an array of bonds in various industries throughout foreign equity securities as well as real estate, securities partnerships
the domestic market for high quality bonds, but only selects those for and hedge funds. Expected long-term market conditions take into
the curve that have an above average return at each duration. The consideration certain key macroeconomic trends including expected
bond portfolio used to construct the curve is monitored to ensure that domestic and foreign GDP growth, employment levels and inflation.
only high quality issues are included. The Company believes that this The expected return assumption is considered reasonable for 2013.
curve is representative of the yields that the Company is able to The Company will be re-assessing its expected return assumption for
achieve in its plan asset investment strategy. As part of its discount rate 2014 given the change in asset mix that occurred during 2013.
setting process, the Company reviewed alternative indices and
determined that they were not materially different than the result
produced by the curve used.
CIGNA CORPORATION - 2013 Form 10-K 85