Chrysler 2002 Annual Report Download - page 44
Download and view the complete annual report
Please find page 44 of the 2002 Chrysler annual report below. You can navigate through the pages in the report by either clicking on the pages listed below, or by using the keyword search tool below to find specific information within the annual report.-
 1
1 -
2
-
3
-
4
-
5
-
6
-
7
-
8
-
9
-
10
-
11
-
12
-
13
-
14
-
15
-
16
-
17
-
18
-
19
-
20
-
21
-
22
-
23
-
24
-
25
-
26
-
27
-
28
-
29
-
30
-
31
-
32
-
33
-
 34
34 -
 35
35 -
 36
36 -
 37
37 -
 38
38 -
 39
39 -
 40
40 -
 41
41 -
 42
42 -
 43
43 -
 44
44 -
 45
45 -
 46
46 -
 47
47 -
 48
48 -
 49
49 -
 50
50 -
 51
51 -
 52
52 -
 53
53 -
 54
54 -
55
-
56
-
57
-
58
-
59
-
60
-
61
-
62
-
63
 |
 |

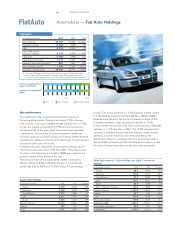
Sales performance
The weakness in the overall economy had an impact on
the automobile market. Demand was down 2.9% in Europe,
with declines in all major markets except Great Britain (+4.3%).
In Italy, the market contracted by 5.9% but bounced back in
the second half of the year, when the government provided
incentives for the purchase of environmentally friendly cars.
A similar situation occurred in Brazil and Poland, where demand
was down for 2002 as a whole but showed signs of improvement
during the latter part of the year.
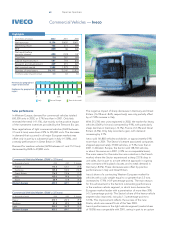
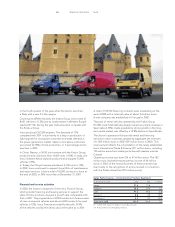
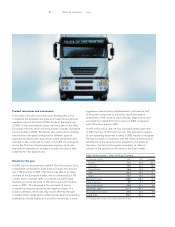
In Western Europe, shipments of commercial vehicles (about
1.8 million units) were down 2.4% from 2001. Only Italy bucked
the trend, with demand up a healthy 18.8% due in part to the
positive impact of the Tremonti Bis Law.
The Sector’s share of the automobile market continued to
decline, falling to 8.2% in Western Europe (1.3 percentage
points less than in 2001) and 30.2% in Italy (-4.4 percentage
points). Fiat Auto’s penetration of the Brazilian market, where
it is the leading producer, fell from 28.5% in 2001 to 25.8%.
Despite weak demand, the Sector increased its share of the
European market for light commercial vehicles to 12.6%.
In this market environment, Fiat Auto sold more than 1,860,000
vehicles, or 11.1% less than in 2001. The 10.5% decrease that
occurred in Western Europe was due mainly to weak market
demand, a further reduction in inventories held by the
distribution network, a strategic decision to decrease sales in
less profitable channels and the limited positive impact on the
full year of several important models launched during the
42 Report on Operations
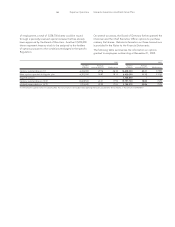
Automobiles — Fiat Auto Holdings
(in millions of euros)
2002
2001 2000
Net revenues 22,147 24,440 25,361
Operating result (1,343)(549) 44
EBIT (2,214)(1,061) 33
Net result before
minority interest (2,739)(1,442) (*) (599)
Cash flow (1,780)(292) 732
Capital expenditures 1,115 1,331 1,412
Research and development 861 870 776
Net invested capital 1,254 2,340 4,220
Number of employees 49,544 55,174 74,292
(*) The year 2000 figure of the Automobile Sector does not include extraordinary
items stemming from the agreement with General Motors worth 460 million
euros that were included in the result of Miscellaneous and Holding Companies.
Highlights
Revenues by geographical
region of destination
Italy Rest of Europe Rest of the world
Employees by geographical
region
050% 100%
Automobile Market
(in thousands of units) 2002 2001 % change
France 2,139 2,250 (4.9)
Germany 3,194 3,278 (2.6)
Great Britain 2,572 2,466 4.3
Italy 2,271 2,413 (5.9)
Spain 1,324 1,422 (6.9)
Western Europe 14,316 14,746 (2.9)
Poland 302 319 (5.3)
Brazil 1,235 1,295 (4.6)
Sales Performance – Automobiles and Light Commercial
Vehicles
(in thousands of units) 2002 2001 % change
France 98.0 103.3 (5.1)
Germany 122.8 147.1 (16.5)
Great Britain 91.0 128.3 (29.1)
Italy 758.7 825.1 (8.0)
Spain 66.5 62.8 5.9
Rest of Western Europe 165.2 188.9 (12.5)
Western Europe 1,302.2 1,455.5 (10.5)
Poland 60.7 76.3 (20.4)
Brazil 358.0 415.9 (13.9)
Rest of the world 139.2 144.5 (3.7)
Total units sold 1,860.1 2,092.2 (11.1)
Associated companies 49.8 34.1 46.0
Grand total 1,909.9 2,126.3 (10.2)