Chrysler 2002 Annual Report Download - page 10
Download and view the complete annual report
Please find page 10 of the 2002 Chrysler annual report below. You can navigate through the pages in the report by either clicking on the pages listed below, or by using the keyword search tool below to find specific information within the annual report.-
 1
1 -
 2
2 -
 3
3 -
 4
4 -
 5
5 -
 6
6 -
 7
7 -
 8
8 -
 9
9 -
 10
10 -
 11
11 -
 12
12 -
 13
13 -
 14
14 -
 15
15 -
 16
16 -
 17
17 -
 18
18 -
 19
19 -
 20
20 -
 21
21 -
22
-
23
-
24
-
25
-
26
-
27
-
28
-
29
-
30
-
31
-
32
-
33
-
34
-
35
-
36
-
37
-
38
-
39
-
40
-
41
-
42
-
43
-
44
-
45
-
46
-
47
-
48
-
49
-
50
-
51
-
52
-
53
-
54
-
55
-
56
-
57
-
58
-
59
-
60
-
61
-
62
-
63
 |
 |

8Report on Operations
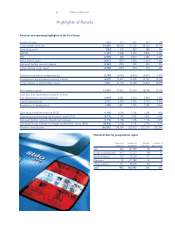
Statistical data by geographical region
Number of Number of Number Number of
companies employees of facilities R&D centers
Italy 269 87,789 68 67
Europe excluding Italy
415 51,733 68 33
North America 123 14,739 31 12
Mercosur 59 21,782 16 8
Other regions 117 10,449 33 7
Total 983 186,492 216 127
Highlights of Results
Financial and operating highlights of the Fiat Group
(in millions of euros) 2002 2001 2000 1999 1998
Consolidated revenues 55,649 58,006 57,555 48,123 45,769
Operating result (762) 318 855 788 746
EBITDA (1,341) 3,408 5,125 3,836 3,631
EBIT (3,955) 528 2,073 1,482 1,321
Result before taxes (4,817) (497) 1,050 1,024 1,442
Net result before minority interest (4,263) (791) 578 506 916
Group interest in net result (3,948) (445) 664 353 621
Net financial position (indebtedness) (3,780) (6,035) (6,467) (4,031) 1,420
Stockholders’ equity before minority interest 8,679 13,607 15,209 14,767 15,120
Group interest in stockholders’ equity 7,641 12,170 13,320 12,874 12,998
Net invested capital 12,459 19,642 21,676 18,798 13,700
Cash flow (net result before minority interest
plus depreciation and amortization) (1,649) 2,089 3,630 2,860 3,226
Capital expenditures 2,771 3,438 3,236 2,712 2,418
Research and development 1,748 1,817 1,725 1,406 1,264
Operating result/net revenues (ROS) (1.4%) 0.5% 1.5% 1.6% 1.6%
Operating result/average net invested capital (ROI) (4.7%) 1.5% 4.2% 4.8% 5.4%
Net result before minority interest/net revenues (7.7%) (1.4%) 1.0% 1.1% 2.0%
Net result/Group interest in average stockholders’ equity (ROE) (39.9%) (3.5%) 5.1% 2.7% 4.7%
Number of employees 186,492 198,764 223,953 221,319 220,549