Chrysler 2002 Annual Report Download - page 13
Download and view the complete annual report
Please find page 13 of the 2002 Chrysler annual report below. You can navigate through the pages in the report by either clicking on the pages listed below, or by using the keyword search tool below to find specific information within the annual report.-
 1
1 -
2
-
 3
3 -
 4
4 -
 5
5 -
 6
6 -
 7
7 -
 8
8 -
 9
9 -
 10
10 -
 11
11 -
 12
12 -
 13
13 -
 14
14 -
 15
15 -
 16
16 -
 17
17 -
 18
18 -
 19
19 -
 20
20 -
 21
21 -
 22
22 -
 23
23 -
24
-
25
-
26
-
27
-
28
-
29
-
30
-
31
-
32
-
33
-
34
-
35
-
36
-
37
-
38
-
39
-
40
-
41
-
42
-
43
-
44
-
45
-
46
-
47
-
48
-
49
-
50
-
51
-
52
-
53
-
54
-
55
-
56
-
57
-
58
-
59
-
60
-
61
-
62
-
63
 |
 |

11 Report on Operations
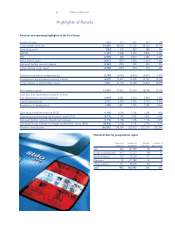
Stockholder base at December 31, 2002
Ordinary shares 433,220,490
IFI-IFIL 30.4%
Generali Group 3.1%
Dodge & Cox 3.8%
Sanpaolo IMI Group 2.6%
Mediobanca 3.1%
Libyan Arab Foreign Inv. Co. 3.0%
Deutsche Bank Group 2.8%
Pictet & C 2.8%
Southeastern Asset Manag 2.7%
Other International Institutional Investors 9.4%
Other Italian Institutional Investors 5.5%
Other Stockholders 30.8%
Preference shares 103,292,310
IFI-IFIL 30.1%
International Institutional Investors 6.6%
Italian Institutional Investors 9.5%
Other Stockholders 53.8%
Savings shares 79,912,800
International Institutional Investors 4.0%
Italian Institutional Investors 6.2%
Other Stockholders 89.8%
N.B.: The holdings of Italian and international institutional investors have
been estimated on the basis of surveys commissioned by the Company.
Highlights per share (in euros) 2000 2001 2002
Cash flow per share 6.622 3.856 (2.911)
Earnings per share 1.186 (0.841) (6.660)
Dividend per share (*)
ordinary and preference shares 0.620 0.310 –
savings shares 0.775 0.465 –
Stockholders’ equity per share at 12/31
24.321 22.462 13.489
Official price per share 12.29.00 12.28.01 12.30.02
ordinary shares 26.340 17.921 7.704
preference shares 17.606 12.267 4.348
savings shares 15.149 11.459 4.183
(*) Reflects the distribution of earnings attributable to the respective year.
Average monthly trading volume (in millions of shares)
Minimum and maximum monthly price (in euros)
Savings shares
Preference shares
Ordinary shares
0
10
20
30
40
50
60
70
80
90
100
12/0211/0210/0209/0208/0207/0206/0205/0204/0203/0202/0201/02
Fiat ordinary shares
01/02 02/02 03/02 04/02 05/02 06/02 07/02 08/02 09/02 10/02 11/02 12/02
20
16
12
8
4
0
Fiat preference shares
01/02 02/02 03/02 04/02 05/02 06/02 07/02 08/02 09/02 10/02 11/02 12/02
14
12
10
8
6
0
4
2
Fiat savings shares
01/02 02/02 03/02 04/02 05/02 06/02 07/02 08/02 09/02 10/02 11/02 12/02
12
10
8
6
4
0
2