Chrysler 2002 Annual Report Download - page 32
Download and view the complete annual report
Please find page 32 of the 2002 Chrysler annual report below. You can navigate through the pages in the report by either clicking on the pages listed below, or by using the keyword search tool below to find specific information within the annual report.-
 1
1 -
2
-
3
-
4
-
5
-
6
-
7
-
8
-
9
-
10
-
11
-
12
-
13
-
14
-
15
-
16
-
17
-
18
-
19
-
20
-
21
-
 22
22 -
 23
23 -
 24
24 -
 25
25 -
 26
26 -
 27
27 -
 28
28 -
 29
29 -
 30
30 -
 31
31 -
 32
32 -
 33
33 -
 34
34 -
 35
35 -
 36
36 -
 37
37 -
 38
38 -
 39
39 -
 40
40 -
 41
41 -
 42
42 -
43
-
44
-
45
-
46
-
47
-
48
-
49
-
50
-
51
-
52
-
53
-
54
-
55
-
56
-
57
-
58
-
59
-
60
-
61
-
62
-
63
 |
 |

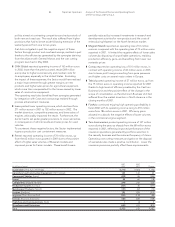
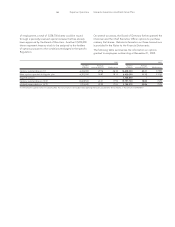
Cash and cash equivalent collected by the centralized
treasury during their activity have been recorded in the
item Financial payables net of intersegment activities in the
Industrial Activities column. However, funds that were
30 Report on Operations Analysis of the Financial Position and Operating Results
of the Fiat Group and Fiat S.p.A.
December 31, 2002 December 31, 2001
Industrial Financial Insurance Industrial Financial Insurance
(in millions of euros) Consolidated Activities Activities Activities Consolidated Activities Activities Activities
Financial payables to others 28,923 21,630 7,115 178 32,697 23,645 9,000 52
(Intersegment financial receivables) –(12,548) (643) (18) –(13,016) (1,027) (120)
Intersegment financial payables –662 12,509 38 –1,182 12,897 84
Financial payables net of intersegment activities
28,923 9,744 18,981 198 32,697 11,811 20,870 16
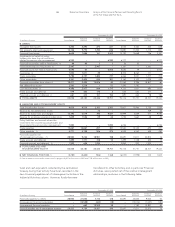
December 31, 2002 December 31, 2001
Industrial Financial Insurance Industrial Financial Insurance
(in millions of euros) Consolidated Activities Activities Activities Consolidated Activities Activities Activities
❚ASSETS
Intangible fixed assets 5,200 4,295 274 631 6,535 5,332 545 658
Net property, plant and equipment 12,106 9,770 1,700 636 13,887 11,352 1,714 821
Financial fixed assets 6,638 7,886 161 3,043 10,190 12,668 146 3,341
Investments on behalf of policy
holders who bear the risk and those
related to pension plan management 6,930 – – 6,930 6,177 – – 6,177
Financial receivables held as fixed assets (*) 48 46 1 1 56 55 – 1
Financial leasing of Group assets (*) 2,947 – 2,947 – 3,367 – 3,367 –
Financial assets not held as fixed assets 6,094 45 – 6,054 5,620 79 – 5,541
Inventories (1) 7,050 7,011 39 – 8,375 8,264 111 –
Trade receivables 5,784 4,157 1,482 737 6,466 5,031 1,417 703
Other receivables 3,351 2,405 835 301 3,162 2,102 1,025 242
Financial receivables from others (*) 18,411 2,495 15,876 40 21,263 2,396 18,807 60
Net deferred tax assets 2,263 2,278 – 57 1,595 1,750 – –
Cash and securities (*)4,996 2,977 844 1,175 4,133 1,831 680 1,622
Trade accruals and deferrals 579 405 176 2 653 434 217 2
Financial accruals and deferrals (*) 661 410 101 150 697 463 78 156
❚TOTAL ASSETS 83,058 44,180 24,436 19,757 92,176 51,757 28,107 19,324
❚LIABILITIES AND STOCKHOLDERS’ EQUITY
Total Stockholders’ Equity 8,679 8,519 2,183 2,262 13,607 13,466 3,130 2,839
Reserve for net deferred tax assets ––72 – ––109 46
Reserve for future risks and charges 15,390 5,519 396 9,647 14,999 5,069 471 9,596
Reserve for employee severance indemnities 1,609 1,536 29 44 1,735 1,664 28 43
Policy liabilities and accruals where the
investment risk is borne by policyholders and
those related to pension plan management 7,000 – – 7,000 6,236 – – 6,236
Trade payables 13,267 12,867 657 321 13,520 13,125 690 247
Other payables (1) 4,771 4,198 506 275 5,029 4,552 545 282
Financial payables net
of intersegment activities (*) 28,923 9,744 18,981 198 32,697 11,811 20,870 16
Trade accruals and deferrals 1,499 1,171 318 10 1,499 1,138 342 19
Financial accruals and deferrals (*) 1,920 626 1,294 – 2,854 932 1,922 –
❚TOTAL LIABILITIES AND
STOCKHOLDERS’ EQUITY 83,058 44,180 24,436 19,757 92,176 51,757 28,107 19,324
❚NET FINANCIAL POSITION (*) (3,780) (4,442) (506) 1,168 (6,035) (7,998) 140 1,823
(1) Net of advances received for contract work in progress (8,227 million euros in 2002 and 7,135 million euros in 2001).
transferred to other Activities, and in particular Financial
Activities, were posted net of the relative intersegment
relationships, as shown in the following table: