CarMax 2001 Annual Report Download - page 86
Download and view the complete annual report
Please find page 86 of the 2001 CarMax annual report below. You can navigate through the pages in the report by either clicking on the pages listed below, or by using the keyword search tool below to find specific information within the annual report.-
 1
1 -
2
-
3
-
4
-
5
-
6
-
7
-
8
-
9
-
10
-
11
-
12
-
13
-
14
-
15
-
16
-
17
-
18
-
19
-
20
-
21
-
22
-
23
-
24
-
25
-
26
-
27
-
28
-
29
-
30
-
31
-
32
-
33
-
34
-
35
-
36
-
37
-
38
-
39
-
40
-
41
-
42
-
43
-
44
-
45
-
46
-
47
-
48
-
49
-
50
-
51
-
52
-
53
-
54
-
55
-
56
-
57
-
58
-
59
-
60
-
61
-
62
-
63
-
64
-
65
-
66
-
67
-
68
-
69
-
70
-
71
-
72
-
73
-
74
-
75
-
 76
76 -
 77
77 -
 78
78 -
 79
79 -
 80
80 -
 81
81 -
 82
82 -
 83
83 -
 84
84 -
 85
85 -
 86
86 -
 87
87 -
 88
88 -
 89
89 -
 90
90
 |
 |

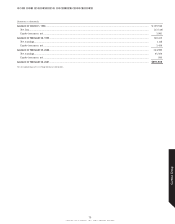
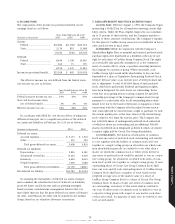
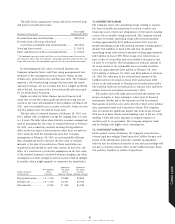
The table below summarizes certain cash flows received from
and paid to securitization trusts:
Year Ended
(Amounts in thousands) February 28, 2001
Proceeds from new securitizations................................ $619,525
Proceeds from collections reinvested
in previous automobile loan securitizations.......... $313,827
Servicing fees received.................................................... $ 10,474
Other cash flows received on retained interests*......... $ 39,265
* This amount represents total cash flows received from retained interests by
the transferor other than servicing fees, including cash flows from interest-only
strips and cash above the minimum required level in cash collateral accounts.
In determining the fair value of retained interests, the
Company estimates future cash flows using management's best
estimates of key assumptions such as finance charge income,
default rates, prepayment rates and discount rates. The Company
employs a risk-based pricing strategy that increases the stated
annual percentage rate for accounts that have a higher predicted
risk of default. Accounts with a lower risk profile also may qual-
ify for promotional financing.
Rights recorded for future finance income from serviced
assets that exceed the contractually specified servicing fees are
carried at fair value and amounted to $42.0 million at February 28,
2001, and are included in net accounts receivable. Gains on sales
of $35.4 million were recorded in fiscal 2001.
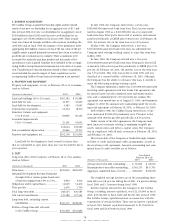
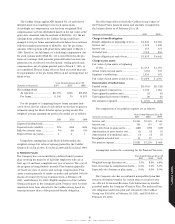
The fair value of retained interests at February 28, 2001, was
$74.1 million with a weighted-average life ranging from 1.5 years
to 1.8 years. The table below shows the key economic assumptions
used in measuring the fair value of retained interests at February
28, 2001, and a sensitivity analysis showing the hypothetical
effect on the fair value of those interests when there are unfavor-
able variations from the assumptions used. Key economic
assumptions at February 28, 2001, are not materially different
than assumptions used to measure the fair value of retained
interests at the time of securitization. These sensitivities are
hypothetical and should be used with caution. In this table, the
effect of a variation in a particular assumption on the fair value
of the retained interest is calculated without changing any other
assumption; in reality, changes in one factor may result in changes
in another, which might magnify or counteract the sensitivities.
Impact on Impact on
Assumptions Fair Value Fair Value
(Dollar amounts Used of 10% of 20%
in thousands) (Annual) Adverse Change Adverse Change
Prepayment speed ......... 1.5 —1.6% $1,840 $3,864
Default rate..................... 1.0 —1.2% $1,471 $3,050
Discount rate.................. 12.0% $ 890 $1,786
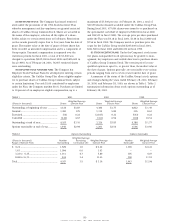
12. INTEREST RATE SWAPS
The Company enters into amortizing swaps relating to automo-
bile loan receivable securitizations to convert variable-rate
financing costs to fixed-rate obligations to better match funding
costs to the receivables being securitized. The Company entered
into nine 40-month amortizing swaps with notional amounts
totaling approximately $735 million in fiscal 2001, four 40-
month amortizing swaps with notional amounts totaling approx-
imately $344 million in fiscal 2000 and four 40-month
amortizing swaps with notional amounts totaling approximately
$387 million in fiscal 1999. These swaps were entered into as
part of sales of receivables and are included in the gain or loss
on sales of receivables. The remaining total notional amount of
all swaps related to the automobile loan receivable securitiza-
tions was approximately $299 million at February 28, 2001,
$327 million at February 29, 2000, and $499 million at February
28, 1999. The reduction in the total notional amount of the
CarMax interest rate swaps in fiscal 2001 and in fiscal 2000
relates to the replacement of floating-rate securitizations with a
$655 million fixed-rate securitization in January 2001 and $644
million fixed-rate securitization in October 1999.
The market and credit risks associated with the interest rate
swaps are similar to those relating to other types of financial
instruments. Market risk is the exposure created by potential
fluctuations in interest rates and is directly related to the product
type, agreement terms and transaction volume. The Company
does not anticipate significant market risk from swaps, because
their use is to more closely match funding costs to the use of the
funding. Credit risk is the exposure to nonperformance of
another party to an agreement. The Company mitigates credit
risk by dealing with highly rated counterparties.
13. CONTINGENT LIABILITIES
In the normal course of business, the Company is involved in
various legal proceedings. Based upon the CarMax Group’s eval-
uation of the information presently available, management
believes that the ultimate resolution of any such proceedings will
not have a material adverse effect on the CarMax Group’s finan-
cial position, liquidity or results of operations.
83
CIRCUIT CITY STORES, INC. 2001 ANNUAL REPORT
Carmax Group