CarMax 2001 Annual Report Download - page 59
Download and view the complete annual report
Please find page 59 of the 2001 CarMax annual report below. You can navigate through the pages in the report by either clicking on the pages listed below, or by using the keyword search tool below to find specific information within the annual report.-
 1
1 -
2
-
3
-
4
-
5
-
6
-
7
-
8
-
9
-
10
-
11
-
12
-
13
-
14
-
15
-
16
-
17
-
18
-
19
-
20
-
21
-
22
-
23
-
24
-
25
-
26
-
27
-
28
-
29
-
30
-
31
-
32
-
33
-
34
-
35
-
36
-
37
-
38
-
39
-
40
-
41
-
42
-
43
-
44
-
45
-
46
-
47
-
48
-
 49
49 -
 50
50 -
 51
51 -
 52
52 -
 53
53 -
 54
54 -
 55
55 -
 56
56 -
 57
57 -
 58
58 -
 59
59 -
 60
60 -
 61
61 -
 62
62 -
 63
63 -
 64
64 -
 65
65 -
 66
66 -
 67
67 -
 68
68 -
 69
69 -
70
-
71
-
72
-
73
-
74
-
75
-
76
-
77
-
78
-
79
-
80
-
81
-
82
-
83
-
84
-
85
-
86
-
87
-
88
-
89
-
90
 |
 |

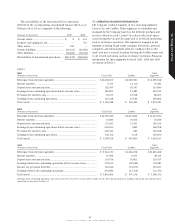
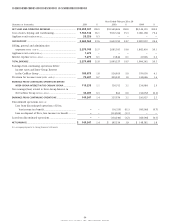
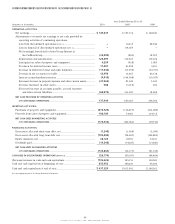
Circuit City Group Statements of Cash Flows
Years Ended February 28 or 29
(Amounts in thousands) 2001 2000 1999
OPERATING ACTIVITIES:
Net earnings.......................................................................................................... $ 149,247 $ 197,334 $ 148,381
Adjustments to reconcile net earnings to net cash provided by
operating activities of continuing operations:
Loss from discontinued operations [NOTE 13].................................................. –16,215 68,546
Loss on disposal of discontinued operations [NOTE 13] ................................. –114,025 —
Net (earnings) loss related to Inter-Group Interest in
the CarMax Group .................................................................................... (34,009) (862) 18,057
Depreciation and amortization ..................................................................... 126,297 132,923 119,724
Loss (gain) on sales of property and equipment ........................................ 4,259 (418) 3,087
Provision for deferred income taxes............................................................ 11,007 41,828 5,951
Decrease in deferred revenue and other liabilities ..................................... (17,442) (17,799) (32,771)
Decrease in net accounts receivable ............................................................ 12,950 12,967 60,138
Increase in merchandise inventory .............................................................. (4,910) (144,598) (16,107)
(Increase) decrease in prepaid expenses and other current assets .............. (41,964) 83,540 5,543
Decrease (increase) in other assets ............................................................... 588 (1,015) 202
(Decrease) increase in accounts payable, accrued expenses
and other current liabilities ..................................................................... (68,074) 216,043 18,609
NET CASH PROVIDED BY OPERATING ACTIVITIES
OF CONTINUING OPERATIONS.......................................................................... 137,949 650,183 399,360
INVESTING ACTIVITIES:
Purchases of property and equipment............................................................... (274,722) (176,873) (214,085)
Proceeds from sales of property and equipment.............................................. 100,189 74,811 134,315
NET CASH USED IN INVESTING ACTIVITIES
OF CONTINUING OPERATIONS.......................................................................... (174,533) (102,062) (79,770)
FINANCING ACTIVITIES:
Decrease in allocated short-term debt, net ....................................................... (1,240) (1,958) (2,180)
Decrease in allocated long-term debt, net ........................................................ (156,402) (74,603) (109,885)
Equity issuances, net ........................................................................................... 38,123 18,591 34,301
Dividends paid...................................................................................................... (14,346) (14,207) (13,981)
NET CASH USED IN FINANCING ACTIVITIES
OF CONTINUING OPERATIONS.......................................................................... (133,865) (72,177) (91,745)
CASH USED IN DISCONTINUED OPERATIONS [NOTE 13]................................................ (26,174) (90,193) (69,844)
(Decrease) increase in cash and cash equivalents ................................................. (196,623) 385,751 158,001
Cash and cash equivalents at beginning of year................................................... 633,952 248,201 90,200
Cash and cash equivalents at end of year.............................................................. $ 437,329 $ 633,952 $ 248,201
See accompanying notes to Group financial statements.
56
CIRCUIT CITY STORES, INC. 2001 ANNUAL REPORT