CarMax 2001 Annual Report Download - page 38
Download and view the complete annual report
Please find page 38 of the 2001 CarMax annual report below. You can navigate through the pages in the report by either clicking on the pages listed below, or by using the keyword search tool below to find specific information within the annual report.-
 1
1 -
2
-
3
-
4
-
5
-
6
-
7
-
8
-
9
-
10
-
11
-
12
-
13
-
14
-
15
-
16
-
17
-
18
-
19
-
20
-
21
-
22
-
23
-
24
-
25
-
26
-
27
-
 28
28 -
 29
29 -
 30
30 -
 31
31 -
 32
32 -
 33
33 -
 34
34 -
 35
35 -
 36
36 -
 37
37 -
 38
38 -
 39
39 -
 40
40 -
 41
41 -
 42
42 -
 43
43 -
 44
44 -
 45
45 -
 46
46 -
 47
47 -
 48
48 -
49
-
50
-
51
-
52
-
53
-
54
-
55
-
56
-
57
-
58
-
59
-
60
-
61
-
62
-
63
-
64
-
65
-
66
-
67
-
68
-
69
-
70
-
71
-
72
-
73
-
74
-
75
-
76
-
77
-
78
-
79
-
80
-
81
-
82
-
83
-
84
-
85
-
86
-
87
-
88
-
89
-
90
 |
 |

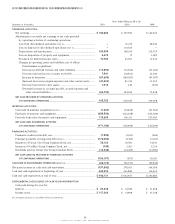
Consolidated Statements of Stockholders Equity
35
CIRCUIT CITY STORES, INC. 2001 ANNUAL REPORT
Circuit City Stores, Inc.
Common Shares Outstanding Common Stock Capital In
Circuit City CarMax Circuit City CarMax Excess of Retained
(Amounts in thousands except per share data) Group Group Group Group Par Value Earnings Total
BALANCE AT MARCH 1, 1998............................................... 99,282 22,204 $ 49,641 $ 11,102 $530,763 $1,138,533 $1,730,039
Net earnings................................................................. — — — — — 142,924 142,924
Exercise of common stock options [NOTE 7]................ 1,004 543 502 272 16,945 — 17,719
Shares issued under Employee
Stock Purchase Plans [NOTE 7]................................. 429 269 215 134 19,431 — 19,780
Shares issued under the 1994 Stock
Incentive Plan [NOTE 7]............................................. 360 100 180 50 14,588 — 14,818
Tax benefit from stock issued.................................... — — — — 9,523 — 9,523
Other.............................................................................. 32 — 16 — 1,445 — 1,461
Shares cancelled upon reacquisition
by Company............................................................ (287) — (144) — (14,239) — (14,383)
Unearned compensation-restricted stock................. — — — — (2,770) — (2,770)
Cash dividends-Circuit City Group Common
Stock ($0.14 per share).......................................... — — — — — (13,981) (13,981)
BALANCE AT FEBRUARY 28, 1999......................................... 100,820 23,116 50,410 11,558 575,686 1,267,476 1,905,130
Effect of two-for-one stock split [NOTE 1] ................... 100,820 — 50,410 — (50,410) — —
Net earnings................................................................. — — — — — 197,590 197,590
Exercise of common stock options [NOTE 7]................ 2,864 2,027 1,432 1,014 34,232 — 36,678
Shares issued under Employee
Stock Purchase Plans [NOTE 7]................................. 502 506 251 253 21,547 — 22,051
Shares issued under the 1994 Stock
Incentive Plan [NOTE 7]............................................. 346 30 173 15 13,996 — 14,184
Tax benefit from stock issued .................................... — — — — 32,459 — 32,459
Shares cancelled upon reacquisition
by Company............................................................ (1,484) (65) (742) (33) (52,173) — (52,948)
Unearned compensation-restricted stock................. — — — — 1,237 — 1,237
Cash dividends-Circuit City Group Common
Stock ($0.07 per share).......................................... — — — — — (14,207) (14,207)
BALANCE AT FEBRUARY 29, 2000......................................... 203,868 25,614 101,934 12,807 576,574 1,450,859 2,142,174
Net earnings................................................................. — — — — — 160,802 160,802
Exercise of common stock options [NOTE 7]................ 1,526 56 763 28 35,391 — 36,182
Shares issued under Employee
Stock Purchase Plans [NOTE 7]................................. 862 — 431 — 16,119 — 16,550
Shares issued under the 1994 Stock
Incentive Plan [NOTE 7]............................................. 1,486 — 743 — 31,912 — 32,655
Tax benefit from stock issued .................................... — — — — 29,839 — 29,839
Shares cancelled upon reacquisition
by Company............................................................ (722) (31) (361) (15) (32,774) — (33,150)
Unearned compensation-restricted stock................. — — — — (14,223) — (14,223)
Cash dividends-Circuit City Group Common
Stock ($0.07 per share).......................................... — — — — — (14,346) (14,346)
BALANCE AT FEBRUARY 28, 2001.........................................
207,020 25,639 $103,510 $12,820 $642,838 $1,597,315 $2,356,483
See accompanying notes to consolidated financial statements.