CarMax 2001 Annual Report Download - page 73
Download and view the complete annual report
Please find page 73 of the 2001 CarMax annual report below. You can navigate through the pages in the report by either clicking on the pages listed below, or by using the keyword search tool below to find specific information within the annual report.-
 1
1 -
2
-
3
-
4
-
5
-
6
-
7
-
8
-
9
-
10
-
11
-
12
-
13
-
14
-
15
-
16
-
17
-
18
-
19
-
20
-
21
-
22
-
23
-
24
-
25
-
26
-
27
-
28
-
29
-
30
-
31
-
32
-
33
-
34
-
35
-
36
-
37
-
38
-
39
-
40
-
41
-
42
-
43
-
44
-
45
-
46
-
47
-
48
-
49
-
50
-
51
-
52
-
53
-
54
-
55
-
56
-
57
-
58
-
59
-
60
-
61
-
62
-
 63
63 -
 64
64 -
 65
65 -
 66
66 -
 67
67 -
 68
68 -
 69
69 -
 70
70 -
 71
71 -
 72
72 -
 73
73 -
 74
74 -
 75
75 -
 76
76 -
 77
77 -
 78
78 -
 79
79 -
 80
80 -
 81
81 -
 82
82 -
 83
83 -
84
-
85
-
86
-
87
-
88
-
89
-
90
 |
 |

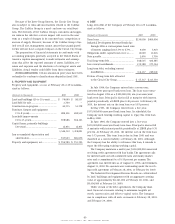
Income Taxes
The Group’s effective income tax rate was 38.0 percent in fiscal
2001 and fiscal 2000, compared with 39.0 percent in fiscal 1999.
In fiscal 1999, the CarMax Group generated a loss and therefore
recorded related income tax benefits.
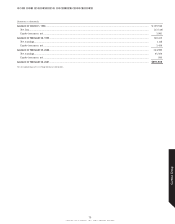
Net Earnings (Loss)
Net earnings were $45.6 million in fiscal 2001, compared with
net earnings of $1.1 million in fiscal 2000 and a net loss of
$23.5 million in fiscal 1999. Excluding the write-off of goodwill,
net earnings would have been $51.0 million in fiscal 2001.
Excluding lease termination costs and the write-down of assets,
net earnings would have been $4.1 million in fiscal 2000.
Net earnings attributed to the CarMax Group Common Stock
were $11.6 million in fiscal 2001, compared with $256,000 in
fiscal 2000 and a net loss of $5.5 million in fiscal 1999.
Operations Outlook
We believe that the higher-than-expected sales and earnings
growth produced in fiscal 2001 indicates that the CarMax busi-
ness has developed a store concept that can generate sustained
profits. We believe that we have in place the infrastructure that
will enable CarMax to maintain its improved level of execution,
generate additional comparable store sales growth and resume
geographic expansion.
In single-store markets, our most mature CarMax stores have
captured market shares of 8 percent to 10 percent. We have iden-
tified approximately 35 additional markets that could support an
“A” store, the standard CarMax store size going forward. We
expect to enter two of these markets, Sacramento, Calif., and
Greensboro, N.C., in late fiscal 2002. We also believe that we can
add another 10 satellite CarMax stores in our existing multi-
store markets. Assuming the CarMax used-car business contin-
ues to meet our expectations, we plan to open, in fiscal 2003,
four to six stores, including openings in single-store markets and
satellite stores in existing multi-store markets, and, in fiscal
2004 through fiscal 2006, six to eight stores per year, again
focusing near-term growth on single-store markets or satellites.
Based on the performance of the existing used-car super-
stores, we believe that a standard “A” store in a single-store
market will at maturity produce sales in the $50 million to $100
million range and a pretax, before non-store overhead, store
operating profit margin in the range of 5.0 percent to 9.5 per-
cent. We believe a satellite store at maturity will produce sales in
the $36 million to $72 million range and a pretax, before non-
store overhead, store operating profit margin in the range of 5.0
percent to 9.3 percent. In both cases, maturity is assumed to be
the fifth year of operation. If we meet our store opening and
sales per store objectives, we believe that CarMax can produce
annual sales volumes of $5 billion within five years. Non-store
overhead, which includes all field operating expenses outside the
store as well as corporate overhead, was 2.3 percent of sales in
fiscal 2001, and we estimate it will decline to approximately
1.7 percent of sales when annual volumes reach $5 billion.
Given the strong fiscal 2001 performance, we are highly opti-
mistic about our growth plan for CarMax. Nevertheless, we will
proceed cautiously as we seek to ensure that all sales growth is
profitable sales growth and that we are delivering an attractive
return on investment.
RECENT ACCOUNTING PRONOUNCEMENTS
Refer to the “Management’s Discussion and Analysis of Results
of Operations and Financial Condition” for Circuit City Stores,
Inc. for a review of recent accounting pronouncements.
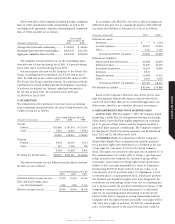
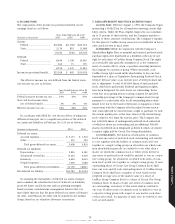
FINANCIAL CONDITION
In fiscal 2001, net cash provided by CarMax operating activities
was $17.8 million. The fiscal 2001 increase reflects a $44.4 mil-
lion increase in net earnings, offset by an increase in inventory.
Net cash used in operating activities was $24.0 million in fiscal
2000 and $80.3 million in fiscal 1999. For the three-year period,
cash primarily was used to purchase inventory related to compa-
rable store sales growth, store openings and additional new-car
franchises. In fiscal 1999, cash also was used to fund net losses.
Most financial activities, including the investment of surplus
cash and the issuance and repayment of short-term and long-
term debt, are managed by the Company on a centralized basis.
Allocated debt of the CarMax Group consists of (1) Company
debt, if any, that has been allocated in its entirety to the CarMax
Group and (2) a portion of the Company’s debt that is allocated
between the Circuit City Group and the CarMax Group. This
pooled debt bears interest at a rate based on the average pooled
debt balance. Expenses related to increases in pooled debt are
reflected in the weighted average interest rate of the pooled debt.
During fiscal 2001, a term loan totaling $175 million was
repaid using the Company's existing working capital. In addi-
tion, a term loan totaling $130 million and due in June 2001
was classified as a current liability. Although we have the ability
to refinance this debt, we intend to repay it using existing working
capital. Payment of corporate pooled debt does not necessarily
result in a reduction of CarMax Group allocated debt.
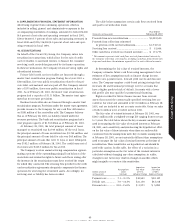
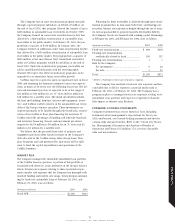
The CarMax Group’s capital expenditures were $10.8 million
in fiscal 2001, $45.4 million in fiscal 2000 and $138.3 million in
fiscal 1999. In fiscal 2001, CarMax’s capital expenditures pri-
marily were related to equipment purchases. CarMax’s capital
expenditures through fiscal 2000 primarily were related to store
expansion. Capital expenditures for the CarMax Group have
been funded through sale-leaseback transactions, landlord reim-
bursements and allocated short- and long-term debt. In fiscal
2002, CarMax anticipates capital expenditures of approximately
$80 million, primarily related to new store construction. Fixed
asset sales, sale-leasebacks and landlord reimbursements trans-
actions totaled $15.5 million in fiscal 2001, $25.3 million in fiscal
2000 and $139.3 million in fiscal 1999.
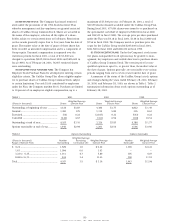
During fiscal 2001, CarMax acquired one new-car franchise
for a total of $1.3 million. In fiscal 2000, CarMax acquired five
new-car franchises for a total of $34.8 million. These acquisitions
were financed through available cash resources, including allocated
debt. Costs in excess of the acquired net tangible assets, which
were primarily inventory, were recorded as goodwill and covenants
not to compete.
70
CIRCUIT CITY STORES, INC. 2001 ANNUAL REPORT