CarMax 2001 Annual Report Download - page 37
Download and view the complete annual report
Please find page 37 of the 2001 CarMax annual report below. You can navigate through the pages in the report by either clicking on the pages listed below, or by using the keyword search tool below to find specific information within the annual report.-
 1
1 -
2
-
3
-
4
-
5
-
6
-
7
-
8
-
9
-
10
-
11
-
12
-
13
-
14
-
15
-
16
-
17
-
18
-
19
-
20
-
21
-
22
-
23
-
24
-
25
-
26
-
 27
27 -
 28
28 -
 29
29 -
 30
30 -
 31
31 -
 32
32 -
 33
33 -
 34
34 -
 35
35 -
 36
36 -
 37
37 -
 38
38 -
 39
39 -
 40
40 -
 41
41 -
 42
42 -
 43
43 -
 44
44 -
 45
45 -
 46
46 -
 47
47 -
48
-
49
-
50
-
51
-
52
-
53
-
54
-
55
-
56
-
57
-
58
-
59
-
60
-
61
-
62
-
63
-
64
-
65
-
66
-
67
-
68
-
69
-
70
-
71
-
72
-
73
-
74
-
75
-
76
-
77
-
78
-
79
-
80
-
81
-
82
-
83
-
84
-
85
-
86
-
87
-
88
-
89
-
90
 |
 |

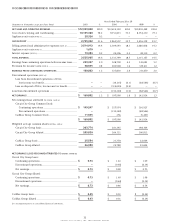
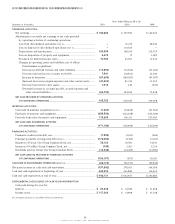
Consolidated Statements of Cash Flows
Years Ended February 28 or 29
(Amounts in thousands) 2001 2000 1999
OPERATING ACTIVITIES:
Net earnings.......................................................................................................... $ 160,802 $ 197,590 $ 142,924
Adjustments to reconcile net earnings to net cash provided
by operating activities of continuing operations:
Loss from discontinued operations [NOTE 16].................................................. –16,215 68,546
Loss on disposal of discontinued operations [NOTE 16].................................. –114,025 —
Depreciation and amortization ..................................................................... 153,090 148,164 129,727
Loss on disposition of property and equipment......................................... 4,674 17 3,087
Provision for deferred income taxes............................................................ 19,765 43,053 17,235
Changes in operating assets and liabilities, net of effects
from business acquisitions:
Decrease in deferred revenue and other liabilities ............................... (17,855) (15,565) (33,022)
Decrease (increase) in net accounts receivable ..................................... 7,541 (18,922) 23,640
Increase in inventory................................................................................ (67,655) (184,507) (97,597)
(Increase) decrease in prepaid expenses and other current assets......... (41,426) 81,316 31,257
Decrease (increase) in other assets.......................................................... 1,012 240 (607)
(Decrease) increase in accounts payable, accrued expenses and
other current liabilities ....................................................................... (64,193) 244,559 33,838
NET CASH PROVIDED BY OPERATING ACTIVITIES
OF CONTINUING OPERATIONS ............................................................................ 155,755 626,185 319,028
INVESTING ACTIVITIES:
Cash used in business acquisitions [NOTE 3]......................................................... (1,325) (34,849) (41,562)
Purchases of property and equipment............................................................... (285,556) (222,268) (352,384)
Proceeds from sales of property and equipment.............................................. 115,695 100,151 273,647
NET CASH USED IN INVESTING ACTIVITIES
OF CONTINUING OPERATIONS ......................................................................... (171,186) (156,966) (120,299)
FINANCING ACTIVITIES:
Payments on short-term debt, net ..................................................................... (1,805) (5,011) (960)
Principal payments on long-term debt [NOTE 5].................................................. (178,060) (2,707) (1,301)
Issuances of Circuit City Group Common Stock, net ...................................... 38,123 18,591 34,301
Issuances of CarMax Group Common Stock, net ............................................ (109) 2,361 2,324
Dividends paid on Circuit City Group Common Stock ................................... (14,346) (14,207) (13,981)
NET CASH (USED IN) PROVIDED BY FINANCING ACTIVITIES
OF CONTINUING OPERATIONS ......................................................................... (156,197) (973) 20,383
CASH USED IN DISCONTINUED OPERATIONS [NOTE 16]................................................ (26,174) (90,193) (69,844)
(Decrease) increase in cash and cash equivalents ................................................. (197,802) 378,053 149,268
Cash and cash equivalents at beginning of year................................................... 643,933 265,880 116,612
Cash and cash equivalents at end of year.............................................................. $ 446,131 $ 643,933 $ 265,880
SUPPLEMENTAL DISCLOSURES OF CASH FLOW INFORMATION
Cash paid during the year for:
Interest................................................................................................................... $ 25,336 $ 34,389 $ 31,858
Income taxes......................................................................................................... $ 117,366 $ 14,908 $ 53,528
See accompanying notes to consolidated financial statements.
34
CIRCUIT CITY STORES, INC. 2001 ANNUAL REPORT