CarMax 2001 Annual Report Download - page 45
Download and view the complete annual report
Please find page 45 of the 2001 CarMax annual report below. You can navigate through the pages in the report by either clicking on the pages listed below, or by using the keyword search tool below to find specific information within the annual report.-
 1
1 -
2
-
3
-
4
-
5
-
6
-
7
-
8
-
9
-
10
-
11
-
12
-
13
-
14
-
15
-
16
-
17
-
18
-
19
-
20
-
21
-
22
-
23
-
24
-
25
-
26
-
27
-
28
-
29
-
30
-
31
-
32
-
33
-
34
-
 35
35 -
 36
36 -
 37
37 -
 38
38 -
 39
39 -
 40
40 -
 41
41 -
 42
42 -
 43
43 -
 44
44 -
 45
45 -
 46
46 -
 47
47 -
 48
48 -
 49
49 -
 50
50 -
 51
51 -
 52
52 -
 53
53 -
 54
54 -
 55
55 -
56
-
57
-
58
-
59
-
60
-
61
-
62
-
63
-
64
-
65
-
66
-
67
-
68
-
69
-
70
-
71
-
72
-
73
-
74
-
75
-
76
-
77
-
78
-
79
-
80
-
81
-
82
-
83
-
84
-
85
-
86
-
87
-
88
-
89
-
90
 |
 |

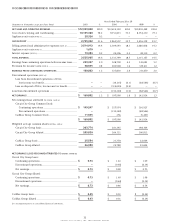
(Amounts in thousands Years Ended February 28 or 29
except per share data) 2001 2000 1999
Circuit City Group:
Earnings from continuing
operations:
As reported........................... $149,247 $327,574 $216,927
Pro forma ............................. 136,957 319,337 211,025
Net earnings:
As reported........................... $149,247 $197,334 $148,381
Pro forma ............................. 136,957 189,097 142,479
Earnings per share from
continuing operations:
Basic – as reported.............. $ 0.73 $ 1.63 $ 1.09
Basic – pro forma................ 0.67 1.59 1.06
Diluted – as reported .......... $ 0.73 $ 1.60 $ 1.08
Diluted – pro forma............ 0.67 1.56 1.05
Net earnings per share:
Basic – as reported.............. $ 0.73 $ 0.98 $ 0.75
Basic – pro forma................ 0.67 0.94 0.72
Diluted – as reported .......... $ 0.73 $ 0.96 $ 0.74
Diluted – pro forma............ 0.67 0.93 0.71
CarMax Group:
Net earnings (loss):
As reported........................... $ 11,555 $ 256 $ (5,457)
Pro forma ............................. 11,345 75 (5,537)
Net earnings (loss) per share:
Basic – as reported.............. $ 0.45 $ 0.01 $ (0.24)
Basic – pro forma................ 0.44 0.00 (0.24)
Diluted – as reported .......... $ 0.43 $ 0.01 $ (0.24)
Diluted – pro forma............ 0.42 0.00 (0.24)
For the purpose of computing the pro forma amounts indi-
cated above, the fair value of each option on the date of grant is
estimated using the Black-Scholes option-pricing model. The
weighted average assumptions used in the model are as follows:
2001 2000 1999
Circuit City Group:
Expected dividend yield ................ 0.2% 0.2% 0.4%
Expected stock volatility ............... 49% 38% 33%
Risk-free interest rates................... 6% 6% 6%
Expected lives (in years)................ 5 5 5
CarMax Group:
Expected dividend yield ................ — — —
Expected stock volatility ............... 71% 62% 50%
Risk-free interest rates................... 7% 6% 6%
Expected lives (in years)................ 4 4 3
Using these assumptions in the Black-Scholes model, the
weighted average fair value of options granted for the Circuit
City Group is $17 in fiscal 2001, $17 in fiscal 2000 and $8 in
fiscal 1999; and for the CarMax Group, $1 in fiscal 2001, $3 in
fiscal 2000 and $3 in fiscal 1999.
8. EARNINGS (LOSS) PER SHARE
Reconciliations of the numerator and denominator of basic and
diluted earnings (loss) per share are presented below.
(Amounts in thousands Years Ended February 28 or 29
except per share data) 2001 2000 1999
Circuit City Group:
Weighted average
common shares........................ 203,774 201,345 198,304
Dilutive potential
common shares:
Options...................................... 885 2,145 1,700
Restricted stock........................ 1,171 831 808
Weighted average common
shares and dilutive
potential common shares....... 205,830 204,321 200,812
Earnings from continuing
operations available to
common shareholders............. $149,247 $327,574 $216,927
Basic earnings per share from
continuing operations ............ $ 0.73 $ 1.63 $ 1.09
Diluted earnings per share from
continuing operations ............ $ 0.73 $ 1.60 $ 1.08
CarMax Group:
Weighted average
common shares ....................... 25,554 23,778 22,604
Dilutive potential common
shares:
Options ..................................... 1,332 1,814 —
Restricted stock ....................... 94 196 —
Weighted average common
shares and dilutive potential
common shares ....................... 26,980 25,788 22,604
Net earnings (loss) available to
common shareholders ............ $ 11,555 $ 256 $ (5,457)
Basic net earnings (loss)
per share................................... $ 0.45 $ 0.01 $ (0.24)
Diluted net earnings (loss)
per share................................... $ 0.43 $ 0.01 $ (0.24)
Certain options were outstanding and not included in the
computation of diluted earnings per share because the options’
exercise prices were greater than the average market price of the
common shares. Options to purchase 8,469,700 shares of Circuit
City Group Common Stock ranging from $14.75 to $47.53 per
share were outstanding and not included in the calculation at
the end of fiscal 2001; 2,900 shares ranging from $43.03 to
$47.53 per share at the end of fiscal 2000; and 2,000,000 shares
at $29.50 per share at the end of fiscal 1999. Options to pur-
chase 1,357,200 shares of CarMax Group Common Stock rang-
ing from $6.06 to $16.31 per share were outstanding and not
included in the calculation at the end of fiscal 2001, and
42
CIRCUIT CITY STORES, INC. 2001 ANNUAL REPORT