CarMax 2001 Annual Report Download - page 66
Download and view the complete annual report
Please find page 66 of the 2001 CarMax annual report below. You can navigate through the pages in the report by either clicking on the pages listed below, or by using the keyword search tool below to find specific information within the annual report.-
 1
1 -
2
-
3
-
4
-
5
-
6
-
7
-
8
-
9
-
10
-
11
-
12
-
13
-
14
-
15
-
16
-
17
-
18
-
19
-
20
-
21
-
22
-
23
-
24
-
25
-
26
-
27
-
28
-
29
-
30
-
31
-
32
-
33
-
34
-
35
-
36
-
37
-
38
-
39
-
40
-
41
-
42
-
43
-
44
-
45
-
46
-
47
-
48
-
49
-
50
-
51
-
52
-
53
-
54
-
55
-
 56
56 -
 57
57 -
 58
58 -
 59
59 -
 60
60 -
 61
61 -
 62
62 -
 63
63 -
 64
64 -
 65
65 -
 66
66 -
 67
67 -
 68
68 -
 69
69 -
 70
70 -
 71
71 -
 72
72 -
 73
73 -
 74
74 -
 75
75 -
 76
76 -
77
-
78
-
79
-
80
-
81
-
82
-
83
-
84
-
85
-
86
-
87
-
88
-
89
-
90
 |
 |

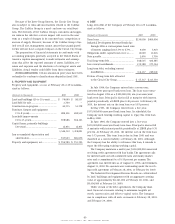
Circuit City Group
The Circuit City Group applies APB Opinion No. 25 and
related interpretations in accounting for its stock option plans.
Accordingly, no compensation cost has been recognized. Had
compensation cost been determined based on the fair value at
the grant date consistent with the methods of SFAS No. 123, the
net earnings attributed to the Circuit City Group would have
changed to the pro forma amounts indicated in the following
table. In accordance with the transition provisions of SFAS No.
123, the pro forma amounts reflect options with grant dates
subsequent to March 1, 1995. Therefore, the full impact of cal-
culating compensation cost for stock options under SFAS No.
123 is not reflected in the pro forma net earnings amounts pre-
sented because compensation cost is reflected over the options’
vesting periods and compensation cost of options granted prior
to March 1, 1995, is not considered. The pro forma effect on fis-
cal year 2001 may not be representative of the pro forma effects
on net earnings for future years.
Years Ended February 28 or 29
(Amounts in thousands) 2001 2000 1999
Earnings from continuing
operations:
As reported ............................ $149,247 $327,574 $216,927
Pro forma............................... 136,957 319,337 211,025
Net earnings:
As reported ............................ $149,247 $197,334 $148,381
Pro forma............................... 136,957 189,097 142,479
For the purpose of computing the pro forma amounts, the fair
value of each option on the date of grant is estimated using the
Black-Scholes option-pricing model. The weighted average
assumptions used in the model are as follows:
2001 2000 1999
Expected dividend yield.................. 0.2% 0.2% 0.4%
Expected stock volatility................. 49% 38% 33%
Risk-free interest rates..................... 6% 6% 6%
Expected lives (in years)................. 5 5 5
Using these assumptions in the Black-Scholes model, the
weighted average fair value of options granted for the Circuit
City Group is $17 in fiscal 2001, $17 in fiscal 2000 and $8 in
fiscal 1999.
7. PENSION PLANS
The Company has a noncontributory defined benefit pension
plan covering the majority of full-time employees who are at
least age 21 and have completed one year of service. The cost of
the program is being funded currently. Plan benefits generally
are based on years of service and average compensation. Plan
assets consist primarily of equity securities and included 160,000
shares of Circuit City Group Common Stock at February 28,
2001, and February 29, 2000. Eligible employees of the Circuit
City Group participate in the Company’s plan. Pension costs for
these employees have been allocated to the Circuit City Group
based on its proportionate share of the projected benefit obligation.
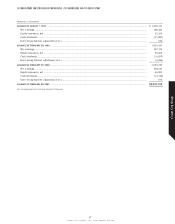
63
CIRCUIT CITY STORES, INC. 2001 ANNUAL REPORT
TABLE 1 2001 2000 1999
Weighted Average Weighted Average Weighted Average
(Shares in thousands) Shares Exercise Price Shares Exercise Price Shares Exercise Price
Outstanding at beginning of year................ 7,380 $25.07 8,894 $18.25 9,988 $16.00
Granted........................................................... 4,280 34.80 1,564 40.75 1,080 21.17
Exercised.......................................................... (1,526) 23.64 (2,864) 12.65 (2,008) 8.77
Cancelled.......................................................... (1,414) 34.25 (214) 22.06 (166) 16.80
Outstanding at end of year........................... 8,720 $28.60 7,380 $25.07 8,894 $18.25
Options exercisable at end of year .............. 3,158 $21.86 1,258 $13.89 2,966 $12.02
TABLE 2 Options Outstanding Options Exercisable
Weighted Average
(Shares in thousands) Number Remaining Weighted Average Number Weighted Average
Range of Exercise Prices Outstanding Contractual Life Exercise Price Exercisable Exercise Price
$ 9.09 to 14.75 ............................................. 1,344 3.8 $14.10 879 $13.93
15.18 to 18.00 ............................................. 1,067 3.0 17.24 876 17.23
18.43 to 25.28 ............................................. 864 4.1 21.11 212 20.78
29.50............................................................. 1,000 1.1 29.50 1,000 29.50
34.84 to 35.21 ............................................. 3,038 7.2 35.21 — —
35.22 to 47.53 ............................................. 1,407 5.4 40.72 191 40.81
Total ................................................................ 8,720 4.9 $28.60 3,158 $21.86