CarMax 2001 Annual Report Download - page 32
Download and view the complete annual report
Please find page 32 of the 2001 CarMax annual report below. You can navigate through the pages in the report by either clicking on the pages listed below, or by using the keyword search tool below to find specific information within the annual report.-
 1
1 -
2
-
3
-
4
-
5
-
6
-
7
-
8
-
9
-
10
-
11
-
12
-
13
-
14
-
15
-
16
-
17
-
18
-
19
-
20
-
21
-
 22
22 -
 23
23 -
 24
24 -
 25
25 -
 26
26 -
 27
27 -
 28
28 -
 29
29 -
 30
30 -
 31
31 -
 32
32 -
 33
33 -
 34
34 -
 35
35 -
 36
36 -
 37
37 -
 38
38 -
 39
39 -
 40
40 -
 41
41 -
 42
42 -
43
-
44
-
45
-
46
-
47
-
48
-
49
-
50
-
51
-
52
-
53
-
54
-
55
-
56
-
57
-
58
-
59
-
60
-
61
-
62
-
63
-
64
-
65
-
66
-
67
-
68
-
69
-
70
-
71
-
72
-
73
-
74
-
75
-
76
-
77
-
78
-
79
-
80
-
81
-
82
-
83
-
84
-
85
-
86
-
87
-
88
-
89
-
90
 |
 |

29
CIRCUIT CITY STORES, INC. 2001 ANNUAL REPORT
Circuit City Stores, Inc.
receivables in the public market. The program had a capacity of
$655 million at the end of fiscal 2001. Securitized receivables
under all CarMax programs totaled $1.28 billion at the end of
fiscal 2001.
The receivables are sold to unaffiliated third parties with
the servicing rights retained. We expect that securitization
programs can be expanded to accommodate future growth for
both businesses.
Capital Structure
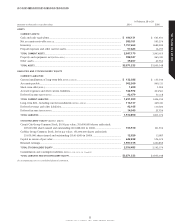
Total assets at February 28, 2001, were $3.87 billion, down $84.0
million, or 2 percent, since February 29, 2000. A $197.8 million
decrease in cash offset by a $68.5 million increase in inventory
primarily contributed to the decrease in total assets.
Over the past three years, expansion for the Circuit City and
CarMax businesses has been funded with internally generated
cash, sale-leaseback transactions, operating leases and short-
term and long-term debt. Finance operation receivables have
been funded through securitization transactions.
During fiscal 2001, stockholders’ equity increased 10 percent
to $2.36 billion. Capitalization for the past five years is illus-
trated in the “Capitalization” table below. Net earnings for the
Circuit City Group and the CarMax Group produced a return on
equity of 7.1 percent in fiscal 2001, compared with 9.8 percent
in fiscal 2000.
We anticipate that in fiscal 2002 capital expenditures of
approximately $295 million will be funded through a combina-
tion of internally generated cash, sale-leaseback transactions,
operating leases or floor plan financing of inventory and that
securitization transactions will finance the growth in receiv-
ables. At the end of fiscal 2001, we maintained a multi-year,
$150 million unsecured revolving credit agreement and $360
million in committed seasonal lines that are renewed annually
with various banks.
The Groups rely on the external debt of Circuit City Stores,
Inc. to provide working capital needed to fund net assets not
otherwise financed through sale-leasebacks or the securitization
of receivables. All significant financial activities of each Group
are managed by the Company on a centralized basis and are
dependent on the financial condition of the Company. These
financial activities include the investment of surplus cash,
issuance and repayment of debt, securitization of receivables,
sale-leasebacks of real estate and Inter-Group loans.
MARKET RISK
The Company manages the private-label and bankcard revolving
loan portfolios of the Circuit City finance operation and the
automobile installment loan portfolio of the CarMax finance
operation. Portions of these portfolios are securitized and, there-
fore, are not presented on the Company’s balance sheets. Interest
rate exposure relating to these receivables represents a market
risk exposure that the Company has managed with matched
funding and interest rate swaps.
Revolving Loans
Interest rates charged on the accounts in the managed private-
label and bankcard portfolios are primarily indexed to the
prime rate, adjustable on a monthly basis, with the balance at a
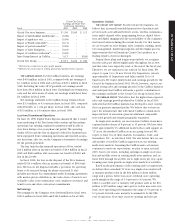
fixed annual percentage rate. Total principal outstanding at
February 28, 2001, and February 29, 2000, had the following
APR structure:
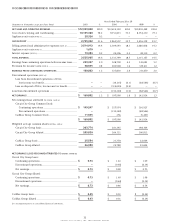
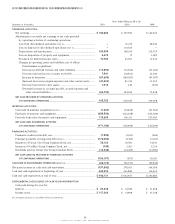
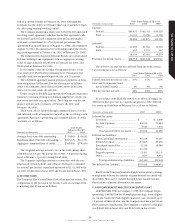
(Amounts in millions) 2001 2000
Indexed to prime rate .......................................... $2,596 $2,631
Fixed APR.............................................................. 203 213
Total........................................................................ $2,799 $2,844
Financing for the securitization programs is achieved primar-
ily through the issuance of public market debt, which is issued at
floating rates based on LIBOR. Receivables held by the Company
for sale are financed with working capital. At February 28, 2001,
and February 29, 2000, financings were as follows:
(Amounts in millions) 2001 2000
Floating-rate (including synthetic
alteration) securitizations.............................. $2,754 $2,689
Fixed-rate securitizations.................................... — 137
Held by the Company for sale ........................... 45 18
Total........................................................................ $2,799 $2,844
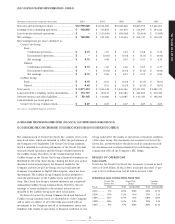
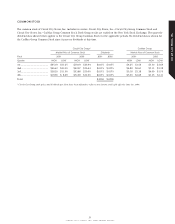
CAPITALIZATION
Fiscal 2001 2000 1999 1998 1997
(Dollar amounts in millions) $ % $% $% $ % $ %
Long-term debt, excluding
current installments................................... 116.1 5 249.2 10 426.6 17 424.3 18 430.3 19
Other long-term liabilities .............................. 107.1 4 157.8 6 149.7 6 171.5 7 199.4 9
Total stockholders’ equity............................... 2,356.5 91 2,142.2 84 1,905.1 77 1,730.0 75 1,614.8 72
Total capitalization .......................................... 2,579.7 100 2,549.2 100 2,481.4 100 2,325.8 100 2,244.5 100