Aflac 2012 Annual Report Download - page 26
Download and view the complete annual report
Please find page 26 of the 2012 Aflac annual report below. You can navigate through the pages in the report by either clicking on the pages listed below, or by using the keyword search tool below to find specific information within the annual report.-
 1
1 -
2
-
3
-
4
-
5
-
6
-
7
-
8
-
9
-
10
-
11
-
12
-
13
-
14
-
15
-
 16
16 -
 17
17 -
 18
18 -
 19
19 -
 20
20 -
 21
21 -
 22
22 -
 23
23 -
 24
24 -
 25
25 -
 26
26 -
 27
27 -
 28
28 -
 29
29 -
 30
30 -
 31
31 -
 32
32 -
 33
33 -
 34
34 -
 35
35 -
 36
36
 |
 |

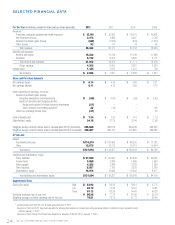
For the Year (In millions, except for share and per-share amounts) 2012 2011 2010 2009
Revenues:
Premiums, principally supplemental health insurance $ 22,148 $ 20,362 $ 18,073 $ 16,621
Net investment income 3,473 3,280 3,007 2,765
Realized investment gains (losses) (349) (1,552) (422) (1,212)
Other income 92 81 74 80
Total revenues 25,364 22,171 20,732 18,254
Benefits and expenses:
Benefits and claims 15,330 13,749 12,106 11,308
Expenses 5,732 5,472 5,065 4,711
Total benefits and expenses 21,062 19,221 17,171 16,019
Pretax earnings 4,302 2,950 3,561 2,235
Income taxes 1,436 1,013 1,233 738
Net earnings $ 2,866 $ 1,937 $ 2,328 $ 1,497
Share and Per-Share Amounts
Net earnings (basic) $ 6.14 $ 4.16 $ 4.96 $ 3.21
Net earnings (diluted) 6.11 4.12 4.92 3.19
Items impacting net earnings, net of tax:
Realized investment gains (losses):
Securities transactions and impairments $ (.69) $ (1.81) $ (.58) $ (1.67)
Impact of derivative and hedging activities:
Hedge costs related to foreign currency investments (.01) – – –
Other derivative and hedging activities* .22 (.34) – (.01)
Other non-operating income (loss) (.01) – – .02
Cash dividends paid $ 1.34 $ 1.23 $ 1.14 $ 1.12
Shareholders’ equity 34.16 27.76 22.44 17.96
Weighted-average common shares used to calculate basic EPS (In thousands) 466,868 466,519 469,038 466,552
Weighted-average common shares used to calculate diluted EPS (In thousands) 469,287 469,370 473,085 469,063
At Year-end
Assets:
Investments and cash $ 118,219 $ 103,462 $ 88,230 $ 73,192
Other 12,875 12,775 12,013 10,914
Total assets $ 131,094 $ 116,237 $ 100,243 $ 84,106
Liabilities and shareholders’ equity:
Policy liabilities $ 97,949 $ 94,593 $ 82,456 $ 69,245
Income taxes 3,858 2,308 1,689 1,653
Notes payable 4,352 3,285 3,038 2,599
Other liabilities 8,957 3,105 2,520 2,192
Shareholders’ equity 15,978 12,946 10,540 8,417
Total liabilities and shareholders’ equity $ 131,094 $ 116,237 $ 100,243 $ 84,106
Supplemental Data
Stock price range: High $ 54.93 $ 59.54 $ 58.31 $ 47.75
Low 38.14 31.25 39.91 10.83
Close 53.12 43.26 56.43 46.25
Yen/dollar exchange rate at year-end ¥ 86.58 ¥ 77.74 ¥ 81.49 ¥ 92.10
Weighted-average yen/dollar exchange rate for the year 79.81 79.75 87.73 93.49
* Includes impact from ASC 815 for all years presented prior to 2011
Amounts in 2010 and 2011 have been adjusted for retrospective adoption of revised accounting guidance related to deferral of policy acquisition costs
effective January 1, 2012.
Amounts in 2002 through 2004 have been adjusted for adoption of SFAS 123R on January 1, 2005.
SELECTED FINANCIAL DATA
24 AFLAC INCORPORATED 2012 YEAR IN REVIEW