Aflac 2012 Annual Report Download - page 23
Download and view the complete annual report
Please find page 23 of the 2012 Aflac annual report below. You can navigate through the pages in the report by either clicking on the pages listed below, or by using the keyword search tool below to find specific information within the annual report.-
 1
1 -
2
-
3
-
4
-
5
-
6
-
7
-
8
-
9
-
10
-
11
-
12
-
 13
13 -
 14
14 -
 15
15 -
 16
16 -
 17
17 -
 18
18 -
 19
19 -
 20
20 -
 21
21 -
 22
22 -
 23
23 -
 24
24 -
 25
25 -
 26
26 -
 27
27 -
 28
28 -
 29
29 -
 30
30 -
 31
31 -
 32
32 -
 33
33 -
34
-
35
-
36
 |
 |

AFLAC U.S.
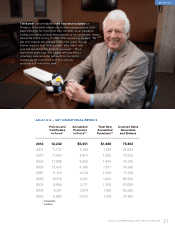
Tim Byrne, vice president at M3 Insurance Solutions in
Madison, Wisconsin, knows about delivering promises. He’s
been doing so for more than four decades as an insurance
broker, providing options that respond to his customers’ needs.
About his firm’s choice to offer Aflac insurance, he says, “My
job is to explain the options and let my client decide!
I never want to hear from a client ‘Why didn’t you
ever tell me about this kind of coverage?’ ” More
than three years ago, Tim began offering Aflac’s
voluntary supplemental products to his clients
to provide his customers with the options
and peace of mind they seek.
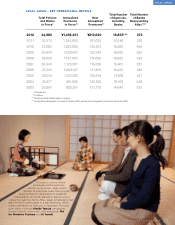
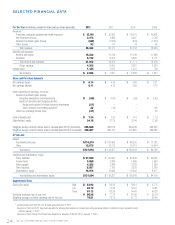
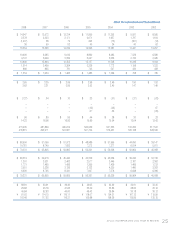
AFLAC U.S. – KEY OPERATIONAL METRICS
Policies and Annualized Total New Licensed Sales
Certificates Premiums Annualized Associates
in Force* in Force** Premiums** and Brokers
2012 12,232 $5,451 $1,488 76,462
2011 11,732 5,188 1,476 74,802
2010 11,436 4,973 1,382 72,535
2009 11,688 4,956 1,453 75,315
2008 11,437 4,789 1,551 74,390
2007 11,116 4,510 1,558 71,258
2006 10,519 4,101 1,423 68,394
2005 9,884 3,711 1,259
63,008
2004 9,341 3,374 1,186 58,992
2003 8,805
3,043
1,128 57,493
*Inthousands
**Inmillions
AFLAC INCORPORATED 2012 YEAR IN REVIEW 21