Aflac 2012 Annual Report Download - page 12
Download and view the complete annual report
Please find page 12 of the 2012 Aflac annual report below. You can navigate through the pages in the report by either clicking on the pages listed below, or by using the keyword search tool below to find specific information within the annual report.-
 1
1 -
 2
2 -
 3
3 -
 4
4 -
 5
5 -
 6
6 -
 7
7 -
 8
8 -
 9
9 -
 10
10 -
 11
11 -
 12
12 -
 13
13 -
 14
14 -
 15
15 -
 16
16 -
 17
17 -
 18
18 -
 19
19 -
 20
20 -
 21
21 -
 22
22 -
23
-
24
-
25
-
26
-
27
-
28
-
29
-
30
-
31
-
32
-
33
-
34
-
35
-
36
 |
 |

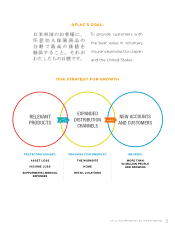
Aflac Japan
Spreading Our Wings and Sharing Our Promise
Aflac Japan took 2012 as another
opportunity to share Aflac’s promise
with more people than ever before.
Following two years of record-breaking
sales and strong growth, we entered
2012 thinking it would be challenging for
Aflac Japan to generate a sales increase.
Instead, Aflac Japan generated a 30.8%
sales increase, and produced solid
financial results.
From a distribution standpoint, our
sales in 2012 were again significantly
influenced by the bank channel sales.
In terms of the product side of our
strategy, Aflac Japan enhanced its
portfolio of products to respond to the
wants and needs of consumers and
distribution channels. In addition, Aflac
Japan has honed its ability to leverage
the popularity of the Aflac Duck to
create separate and unique characters
to market specific products. In 2012,
Aflac Japan remained the leading seller
of cancer and medical insurance policies
in Japan.
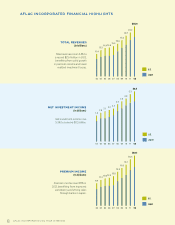
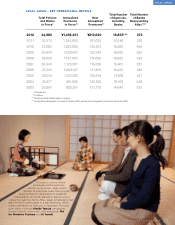
2012 FINANCIAL HIGHLIGHTS IN YEN
Premium income rose 9.9% to ¥1.37 trillion, compared with ¥1.25
trillion in 2011.
Total revenues rose 9.4% to ¥1.60 trillion, compared with ¥1.46
trillion in 2011.
Pretax operating earnings rose 2.0% to ¥311.5 billion, compared
with ¥305.3 billion in 2011.
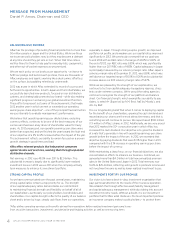
THE IMPACT OF THE YEN/DOLLAR EXCHANGE RATE
Aflac Japan collects premiums in yen, pays benefits and expenses in yen,
and primarily holds yen-denominated assets to support yen-denominated
liabilities. With the exception of a limited number of transactions, we do
not convert yen into dollars. Therefore, currency changes do not have a
material effect on Aflac in economic terms. However, for financial reporting
purposes, we translate Aflac Japan’s income statement from yen into
dollars using an average exchange rate, which does influence our reported
financial results in dollar terms. Translating Aflac Japan’s results from yen
into dollars means that growth rates are magnified in dollar terms when
the yen strengthens against the dollar, compared with the preceding year.
Conversely, growth rates in dollar terms are lower when the yen is weaker
to the dollar in comparison to the prior year. During 2012, the yen averaged
79.81 to the dollar, relatively unchanged from 2011.
2012 FINANCIAL HIGHLIGHTS IN DOLLARS
Premium income rose 9.8% to $17.2 billion, up from $15.6 billion
in 2011.
Total revenues rose 9.3% to $20.1 billion, compared with $18.4
billion in 2011.
Pretax operating earnings rose 2.0% to $3.9 billion from
$3.8 billion in 2011.
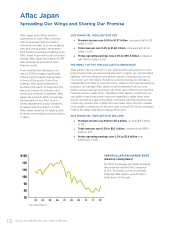
03 04 05 06 07 08 09 10 11 12
90
100
80
70
110
120
¥130
YEN/DOLLAR EXCHANGE RATE
(Quarterly Closing Rates)
For 2012, the average yen/dollar exchange
rate remained relatively flat, compared
to 2011. This means currency minimally
impacted Aflac Japan’s growth rates in
dollar terms for the year.
Source: Bloomberg ©
10 AFLAC INCORPORATED 2012 YEAR IN REVIEW