Aflac 2012 Annual Report Download - page 10
Download and view the complete annual report
Please find page 10 of the 2012 Aflac annual report below. You can navigate through the pages in the report by either clicking on the pages listed below, or by using the keyword search tool below to find specific information within the annual report.-
 1
1 -
 2
2 -
 3
3 -
 4
4 -
 5
5 -
 6
6 -
 7
7 -
 8
8 -
 9
9 -
 10
10 -
 11
11 -
 12
12 -
 13
13 -
 14
14 -
 15
15 -
 16
16 -
 17
17 -
 18
18 -
 19
19 -
 20
20 -
 21
21 -
22
-
23
-
24
-
25
-
26
-
27
-
28
-
29
-
30
-
31
-
32
-
33
-
34
-
35
-
36
 |
 |
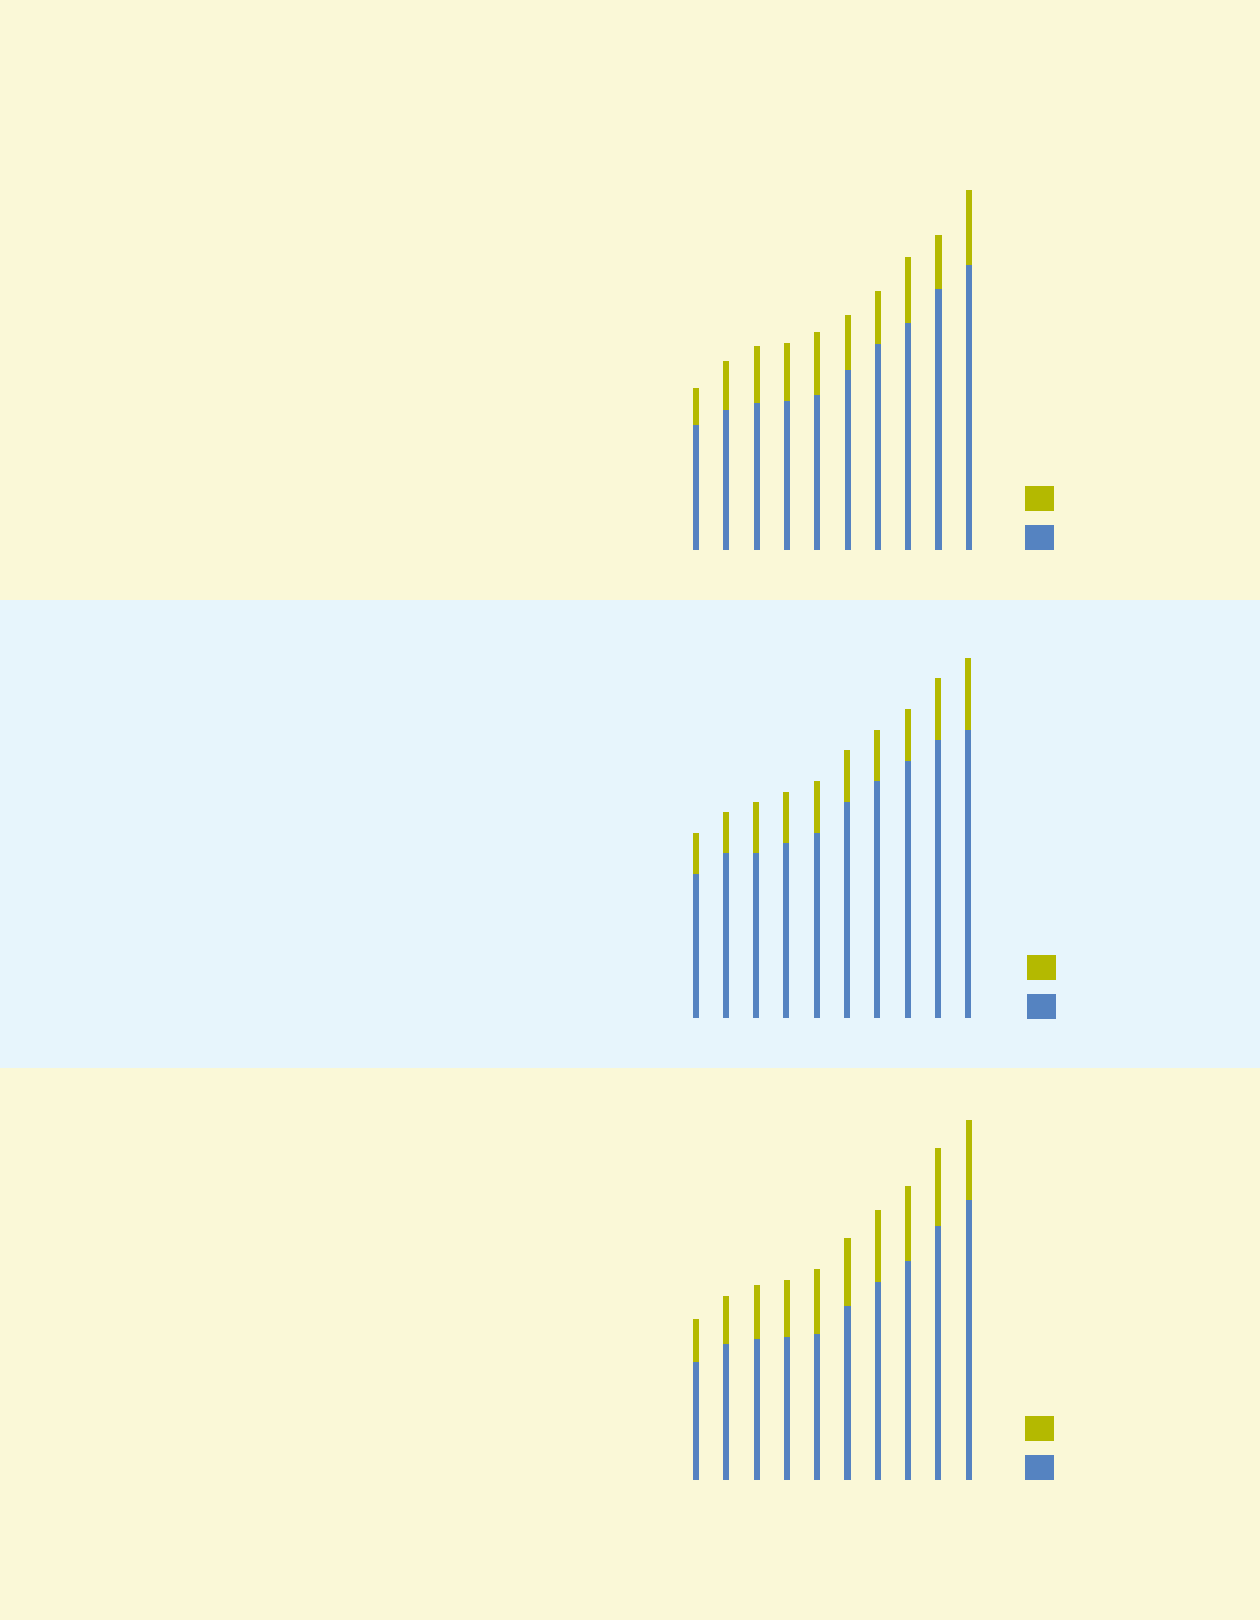
03 04 05 06 07 08 09 10 11 12
U.S.
Japan
20.7
11.4
13.3
14.4 14.6 15.4
16.6
18.3
22.2
$25.4
03 04 05 06 07 08 09 10 11 12
3.0
1.8
2.0 2.1 2.2 2.3
2.6
2.8
3.3
$3.5
U.S.
Japan
03 04 05 06 07 08 09 10 11 12
U.S.
Japan
18.1
9.9
11.3 12.0 12.3 13.0
14.9
16.6
20.4
$22.1
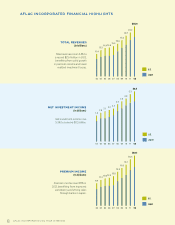
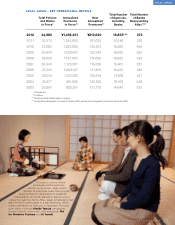
AFLAC INCORPORATED FINANCIAL HIGHLIGHTS
TOTAL REVENUES
(In billions)
Total revenues rose 14.4% to
a record $25.4 billion in 2012,
benefiting from solid growth
in premium income and lower
realized investment losses.
NET INVESTMENT INCOME
(In billions)
Net investment income rose
5.9% to a record $3.5 billion.
PREMIUM INCOME
(In billions)
Premium income rose 8.8% in
2012, benefiting from improved
persistency and strong sales
through banks in Japan.
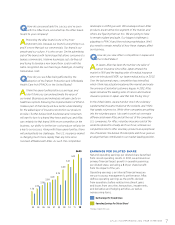
8 AFLAC INCORPORATED 2012 YEAR IN REVIEW