Aflac 2012 Annual Report Download - page 11
Download and view the complete annual report
Please find page 11 of the 2012 Aflac annual report below. You can navigate through the pages in the report by either clicking on the pages listed below, or by using the keyword search tool below to find specific information within the annual report.-
 1
1 -
 2
2 -
 3
3 -
 4
4 -
 5
5 -
 6
6 -
 7
7 -
 8
8 -
 9
9 -
 10
10 -
 11
11 -
 12
12 -
 13
13 -
 14
14 -
 15
15 -
 16
16 -
 17
17 -
 18
18 -
 19
19 -
 20
20 -
 21
21 -
 22
22 -
23
-
24
-
25
-
26
-
27
-
28
-
29
-
30
-
31
-
32
-
33
-
34
-
35
-
36
 |
 |

03 04 05 06 07 08 09 10 11 12
100.2
51.0
59.3 56.4 59.8
65.8
79.3 84.1
116.2
$131.1
U.S.
Japan
03 04 05 06 07 08 09 10 11 12
88.2
44.1
52.0 49.052.0 57.1
68.6 73.2
103.5
$118.2
U.S.
Japan
03 04 05 06 07 08 09 10 11 12
12.1
7.5
8.5 8.9 9.0 9.3
10.5
11.3
13.7
$15.3
U.S.
Japan
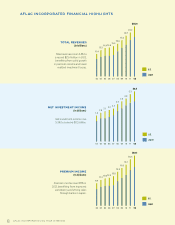
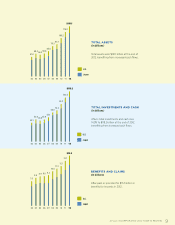
TOTAL ASSETS
(In billions)
Total assets were $131.1 billion at the end of
2012, benefiting from increased cash flows.
TOTAL INVESTMENTS AND CASH
(In billions)
Aflac’s total investments and cash rose
14.3% to $118.2 billion at the end of 2012,
benefiting from increased cash flows.
BENEFITS AND CLAIMS
(In billions)
Aflac paid or provided for $15.3 billion in
benefits for insureds in 2012.
AFLAC INCORPORATED 2012 YEAR IN REVIEW 9