Abercrombie & Fitch 2005 Annual Report Download - page 35
Download and view the complete annual report
Please find page 35 of the 2005 Abercrombie & Fitch annual report below. You can navigate through the pages in the report by either clicking on the pages listed below, or by using the keyword search tool below to find specific information within the annual report.-
 1
1 -
2
-
3
-
4
-
5
-
6
-
7
-
8
-
9
-
10
-
11
-
12
-
13
-
14
-
15
-
16
-
17
-
18
-
19
-
20
-
21
-
22
-
23
-
24
-
 25
25 -
 26
26 -
 27
27 -
 28
28 -
 29
29 -
 30
30 -
 31
31 -
 32
32 -
 33
33 -
 34
34 -
 35
35 -
 36
36 -
 37
37 -
 38
38 -
 39
39 -
 40
40 -
 41
41 -
 42
42 -
 43
43 -
 44
44 -
 45
45 -
46
-
47
-
48
 |
 |

Abercrombie &Fitch
33
FAIR VALUE OF FINANCIAL INSTRUMENTS The recorded
values of current assets and current liabilities, including receivables,
marketable securities and accounts payable, approximate fair value due
to the short maturity and because the average interest rate approxi-
mates current market origination rates.
STOCK-BASED COMPENSATION The Company reports stock-
based compensation through the disclosure-only requirements of
SFAS No. 123, “Accounting for Stock-Based Compensation,” as amended
by SFAS No. 148, “Accounting for Stock-Based Compensation–Transition
and Disclosure–an Amendment of FASB No. 123,” but elects to measure
compensation expense using the intrinsic value method in accordance
with Accounting Principles Board Opinion No. 25, “Accounting for
Stock Issued to Employees.” Accordingly, no compensation expense for
options has been recognized because all options are granted at fair
market value on the grant date. The Company recognizes compensa-
tion expense related to restricted share awards. If compensation
expense related to options had been determined based on the estimat-
ed fair value of options granted in Fiscal 2005, Fiscal 2004 and Fiscal
2003, consistent with the methodology in SFAS 123, the pro forma
effect on net income and net income per basic and fully-diluted share
would have been as follows:
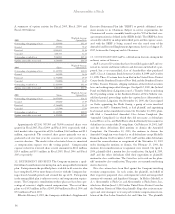
(Thousands except per share amounts) 2005 2004 2003
Net Income:
As reported $333,986 $216,376 $204,830
Stock-based compensation expense
included in reported net income, net of tax(1) 14,716 6,358 3,250
Stock-based compensation expense
determined under fair value based method,
net of tax (36,689) (27,720) (27,274)
Pro forma $312,013 $195,014 $180,806
Basic net income per share:
As reported $3.83 $2.33 $2.12
Pro forma $3.58 $2.10 $1.87
Fully-diluted net income per share:
As reported $3.66 $2.28 $2.06
Pro forma $3.38 $2.05 $1.83
(1) Includes stock-based compensation expense related to restricted share awards actually
recognized in earnings in each period presented using the intrinsic value method.
The average weighted-average fair value of options were $23.01,
$15.05 and $14.18 for Fiscal 2005, Fiscal 2004 and Fiscal 2003, respective-
ly. The fair value of each option was estimated using the Black-Scholes
option-pricing model, which is included in the pro forma results above.
For purposes of the valuation, the following weighted-average assump-
tions were used:
2005 2004 2003
Dividend yield 1.1% 1.3% –
Price volatility 47% 56% 63%
Risk-free interest rate 4.0% 3.2% 3.0%
Annual forfeiture rate 5.7% 6.4% 5.3%
Expected life (years) 4 4 4
For options granted to non-associate directors during Fiscal 2005, the
weighted-average fair value of the options was $8.42. The fair value of
each option was estimated using the Black-Scholes option-pricing
model, which is included in the pro forma results above. For purposes
of the valuation, the following weighted-average assumptions were
used: a 1.23% dividend yield; stock price volatility over the expected
term of 37%; risk-free interest rate of 3.33%; annual forfeiture rate of
9%; and expected term of one year.
EARNINGS PER SHARE Net income per share is computed in
accordance with SFAS No. 128, “Earnings Per Share.” Net income per
basic share is computed based on the weighted-average number of
outstanding shares of common stock. Net income per fully-diluted
share includes the weighted-average effect of dilutive stock options
and restricted shares.
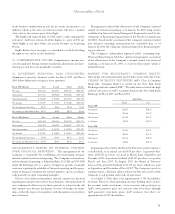
Weighted–Average Shares Outstanding (thousands):
2005 2004 2003
Shares of Class A Common Stock issued 103,300 103,300 103,300
Treasury shares oustanding (16,139) (10,523) (6,467)
Basic shares outstanding 87,161 92,777 96,833
Dilutive effect of options and
restricted shares 4,060 2,333 2,747
Fully-diluted shares outstanding 91,221 95,110 99,580
Options to purchase 150,500, 5,213,000 and 6,151,000 shares of Class A
Common Stock were outstanding at the end of Fiscal 2005, Fiscal 2004
and Fiscal 2003, respectively, but were not included in the computation of
net income per fully-diluted share because the options’ exercise prices
were greater than the average market price of the underlying shares.
USE OF ESTIMATES IN THE PREPARATION OF FINAN-
CIAL STATEMENTS The preparation of financial statements in
conformity with GAAP requires management to make estimates and
assumptions that affect the reported amounts of assets and liabilities as
of the date of the financial statements and the reported amounts of rev-
enues and expenses during the reporting period. Since actual results
may differ from those estimates, the Company revises its estimates and
assumptions as new information becomes available.
3. RECENTLY ISSUED ACCOUNTING PRONOUNCEMENTS
In December 2004, the Financial Accounting Standards Board
(“FASB”) issued SFAS No. 123 (Revised 2004), “Share-Based
Payment.” This standard is a revision of SFAS No. 123 and requires all
share-based payments to employees, including grants of employee
stock options and similar awards, to be recognized in the financial
statements based on their fair values measured at the grant date.
In April 2005, the Securities and Exchange Commission delayed
the effective date of SFAS No. 123(R) to annual periods beginning
after June 15, 2005 for public companies. The Company adopted
SFAS 123(R) at the beginning of the first quarter of Fiscal 2006 using
the modified prospective application transition method. Based on