Abercrombie & Fitch 2005 Annual Report Download - page 17
Download and view the complete annual report
Please find page 17 of the 2005 Abercrombie & Fitch annual report below. You can navigate through the pages in the report by either clicking on the pages listed below, or by using the keyword search tool below to find specific information within the annual report.-
 1
1 -
2
-
3
-
4
-
5
-
6
-
 7
7 -
 8
8 -
 9
9 -
 10
10 -
 11
11 -
 12
12 -
 13
13 -
 14
14 -
 15
15 -
 16
16 -
 17
17 -
 18
18 -
 19
19 -
 20
20 -
 21
21 -
 22
22 -
 23
23 -
 24
24 -
 25
25 -
 26
26 -
 27
27 -
28
-
29
-
30
-
31
-
32
-
33
-
34
-
35
-
36
-
37
-
38
-
39
-
40
-
41
-
42
-
43
-
44
-
45
-
46
-
47
-
48
 |
 |

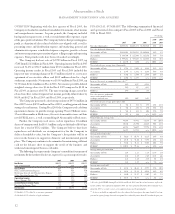
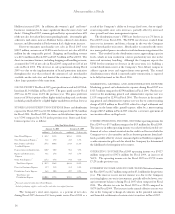
STORES AND DISTRIBUTION EXPENSE Stores and distribution
expense for the fourth quarter of Fiscal 2005 was $293.5 million com-
pared to $223.8 million for the comparable period in Fiscal 2004. The
stores and distribution expense rate (stores and distribution expense
divided by net sales) for the fourth quarter of Fiscal 2005 was 30.5%
compared to 32.6% in the fourth quarter of Fiscal 2004. Stores and
distribution expense was as follows:
Thirteen Weeks Ended
January 28, 2006 January 29, 2005
(millions) % of net sales (millions) % of net sales
Store Payroll Expense $101.5 10.6% $ 74.6 10.9%
Store Management Expense
(1)
12.4 1.3% 7.7 1.1%
Rent, Utilities and Other 75.0 7.8% 57.5 8.4%
Landlord Expense
Depreciation and Amortization 29.4 3.1% 28.1 4.1%
Repairs and Maintenance 8.5 0.9% 8.3 1.2%
Expense
Other Store Expenses
(2)
45.9 4.8% 30.8 4.5%
Total Stores Expense $272.7 28.4% $207.0 30.1%
Direct-to-Consumer Expense 13.1 1.4% 10.6 1.5%
Distribution Center Expense 7.7 0.8% 6.2 0.9%
Total Stores and
Distribution Expense $293.5 30.5% $223.8 32.6%
(1)
Previously reported within Store Payroll Expense.
(2)
Includes packaging, supplies, credit card fees and other store support functions.
The Company’s total store expense, as a percent of net sales, dur-
ing the fourth quarter of Fiscal 2005 decreased 170 basis points versus
the comparable period during Fiscal 2004 as a result of the Company’s
ability to leverage fixed costs due to significant comparable store sales
increases partially offset by increases in store management and loss pre-
vention programs during Fiscal 2005. The Company believes that the
increases in store management and loss prevention programs were key
in driving sales and reducing shrink levels during the quarter, which
had a favorable impact on the Company’s gross profit rate.
The distribution center productivity level, measured in units
processed per labor hour (“UPH”), was 20% lower in the fourth
quarter of Fiscal 2005 versus the fourth quarter of Fiscal 2004. The
UPH rate decrease resulted from increases in inventory and from a
change in the way the Company flowed merchandise to its stores.
Merchandise was routed to the stores in a more gradual process in
order to avoid stockroom congestion at the stores. This resulted in
the distribution center approaching capacity levels, which in turn
resulted in a lower productivity rate due to the increased inventory
handling. Although the Company expects the UPH level to continue
to decrease in the near term, it is building a second distribution cen-
ter at the Company’s New Albany campus to address capacity issues
and support future store growth. The second distribution center,
which is currently under construction, is expected to be fully func-
tional in late Fiscal 2006.
MARKETING, GENERAL AND ADMINISTRATIVE EXPENSE
Marketing, general and administrative expense during the fourth quarter
of Fiscal 2005 was $80.8 million compared to $66.1 million during the
same period in Fiscal 2004. For the fourth quarter of Fiscal 2005, the
marketing, general and administrative expense rate (marketing, general
and administrative expense divided by net sales) was 8.4% compared to
9.6% in the fourth quarter of Fiscal 2004. The decrease in the marketing,
general and administrative expense rate was due to the Company’s
ability to leverage home office payroll, a reduction in sample expenses
and marketing expenses due to timing of photo shoots, offset by increases
in outside services mostly due to legal costs.
OTHER OPERATING INCOME, NET Fourth quarter other oper-
ating income for Fiscal 2005 was $2.3 million compared to $4.3 million for
the fourth quarter of Fiscal 2004. The decrease was related to the amount
of the gift card liability recognized as other income for gift cards for which
the Company has determined the likelihood of redemption to be remote.
OPERATING INCOME Operating income during the fourth quar-
ter of Fiscal 2005 increased to $267.5 million from $170.2 million in
Fiscal 2004, an increase of 57.2%. The operating income rate (operating
income divided by net sales) for the fourth quarter of Fiscal 2005 was
27.8% compared to 24.8% for the fourth quarter of Fiscal 2004.
INTEREST INCOME AND INCOME TAXES Fourth quarter
net interest income was $2.4 million in Fiscal 2005 compared to $1.3
million during the comparable period in Fiscal 2004. The increase in
net interest income was due to higher rates on investments, partially
offset by lower average investment balances during the fourth quarter
of Fiscal 2005 when compared to the same period in Fiscal 2004. The
Company continued to invest in investment grade municipal notes
and bonds and investment grade auction rate securities. The effective
tax rate for the fourth quarter of Fiscal 2005 was 39.0% compared to
39.2% for the Fiscal 2004 comparable period.
NET INCOME AND NET INCOME PER SHARE Net income for
the fourth quarter of Fiscal 2005 was $164.6 million versus $104.3 mil-
lion for the fourth quarter of Fiscal 2004, an increase of 57.8%. Net
income per fully-diluted weighted-average share outstanding for the
fourth quarter of Fiscal 2005 was $1.80 versus $1.15 for the same period
last year, an increase of 56.5%.
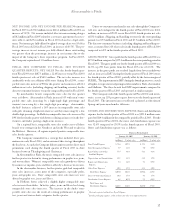
FISCAL 2005 RESULTS: NET SALES Net sales for Fiscal 2005
were $2.785 billion, an increase of 37.8% versus Fiscal 2004 net sales
of $2.021 billion. The net sales increase was attributable to an
increase in comparable stores sales of 26% for the year, the net addi-
tion of 63 stores during Fiscal 2005 and a $13.9 million increase in net
sales (including shipping and handling revenue) for the direct-to-
consumer business.
For the fiscal year, comparable store sales by brand were as follows:
Abercrombie & Fitch increased 18%; abercrombie increased 54%;
Abercrombie &Fitch
15