Abercrombie & Fitch 2005 Annual Report Download - page 20
Download and view the complete annual report
Please find page 20 of the 2005 Abercrombie & Fitch annual report below. You can navigate through the pages in the report by either clicking on the pages listed below, or by using the keyword search tool below to find specific information within the annual report.-
 1
1 -
2
-
3
-
4
-
5
-
6
-
7
-
8
-
9
-
 10
10 -
 11
11 -
 12
12 -
 13
13 -
 14
14 -
 15
15 -
 16
16 -
 17
17 -
 18
18 -
 19
19 -
 20
20 -
 21
21 -
 22
22 -
 23
23 -
 24
24 -
 25
25 -
 26
26 -
 27
27 -
 28
28 -
 29
29 -
 30
30 -
31
-
32
-
33
-
34
-
35
-
36
-
37
-
38
-
39
-
40
-
41
-
42
-
43
-
44
-
45
-
46
-
47
-
48
 |
 |

Abercrombie &Fitch
The Company’s total store expense for the fourth quarter of Fiscal
2004, as a percent of net sales, increased versus the comparable period
during Fiscal 2003 as a result of the Company beginning to implement
its store investment program during this period, offset by leverage of rent,
utilities and other landlord expense as a result of the increase in compa-
rable store sales. In the fourth quarter of Fiscal 2004, the distribution
center’s UPH increased 10% over Fiscal 2003 fourth quarter results.
MARKETING, GENERAL AND ADMINISTRATIVE EXPENSE
Marketing, general and administrative expense during the fourth
quarter of Fiscal 2004 was $66.1 million compared to $37.1 million
during the same period in Fiscal 2003. For the fourth quarter of Fiscal
2004, the marketing, general and administrative expense rate was 9.6%
compared to 6.6% in the fourth quarter of Fiscal 2003. The increase in
the marketing, general and administrative expense rate was due to
higher home office payroll expense as a result of additional headcount
in the home office, incentive compensation and legal expense.
OTHER OPERATING INCOME, NET Fourth quarter other oper-
ating income for Fiscal 2004 was $4.3 million compared to $459,000 for the
fourth quarter of Fiscal 2003. The increase was related to the amount of
gift card liability recognized as other income for gift cards for which the
Company has determined the likelihood of redemption to be remote.
OPERATING INCOME Operating income for the fourth quarter
of Fiscal 2004 increased to $170.2 million from $154.8 million in Fiscal
2003. The operating income rate was 24.8% for the fourth quarter of
Fiscal 2004 compared to 27.6% for the fourth quarter of Fiscal 2003.
INTEREST INCOME AND INCOME TAXES Fourth quarter
net interest income for Fiscal 2004 was $1.3 million compared with
net interest income of $1.1 million for the comparable period in
Fiscal 2003. The increase in net interest income was due to higher
rates during the fourth quarter of Fiscal 2004 when compared to the
same period in Fiscal 2003. The Company continued to invest in
tax-free securities for the majority of the quarter and then changed
its investing strategy to taxable money market investments. The
effective tax rate for the fourth quarter was 39.2% compared to 39.3%
for the Fiscal 2003 comparable period.
NET INCOME AND NET INCOME PER SHARE Net income for
the fourth quarter of Fiscal 2004 was $104.3 million versus $94.6 million
for the same period in Fiscal 2003, an increase of 10.3%. Net income
per fully-diluted weighted-average share outstanding for the fourth
quarter of Fiscal 2004 was $1.15 versus $0.97 for the fourth quarter of
Fiscal 2003, an increase of 18.6%. The percentage increase in net
income per fully-diluted shares outstanding was greater than the per-
centage increase in net income due to the Company’s share repurchase
program. In the fourth quarter of Fiscal 2004 the Company had fully-
diluted weighted-average shares outstanding of 90.8 million versus 97.8
million in the fourth quarter of Fiscal 2003.
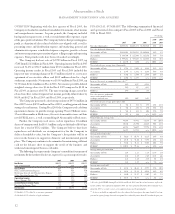
FISCAL 2004 RESULTS: NET SALES Net sales for Fiscal 2004
reached $2.021 billion, an increase of 18.3% versus Fiscal 2003 net sales
of $1.708 billion. The net sales increase was attributable to the net
addition of 88 stores during Fiscal 2004, an increase in comparable
store sales of 2% for the year and an increase in the direct-to-consumer
business net sales (including shipping and handling revenue) of $35.6
million versus Fiscal 2003.
For the fiscal year, comparable store sales by brand were as follows:
Abercrombie & Fitch declined 1%; abercrombie increased 1%; Hollister
increased 13%. The women’s, girls’ and bettys’ businesses in each
brand continued to be more significant than the men’s, boys’ and
dudes’. During Fiscal 2004, women, bettys and girls represented over
60% of the net sales for each of the brands. Hollister bettys achieved a
mid-teens increase and abercrombie girls posted a mid-single digit
increase in comparable store sales for Fiscal 2004, while Abercrombie &
Fitch women had a low-single digit decrease.
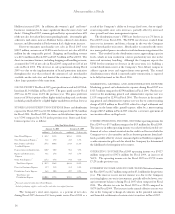
Direct-to-consumer merchandise net sales through the Company’s
web sites and catalogue for Fiscal 2004 were $110.6 million, an increase
of 37.6% versus net sales of $80.4 million in Fiscal 2003. The Company
added a Hollister direct-to-consumer business during the 2003 Back-to-
School selling season. Shipping and handling revenue for the corre-
sponding periods was $15.7 million in Fiscal 2004 and $10.2 million in
Fiscal 2003. The direct-to-consumer business, including shipping and
handling revenue, accounted for 6.2% of net sales compared to 5.3% for
Fiscal 2004 and Fiscal 2003, respectively.
GROSS PROFIT For Fiscal 2004, gross profit increased to $1.341
billion from $1.083 billion in Fiscal 2003. The gross profit rate in Fiscal
2004 was 66.4% versus 63.4% in Fiscal 2003. The increase was driven
by improvements in IMU across Abercrombie & Fitch, abercrombie
and Hollister due to higher average unit retail pricing, especially in
Abercrombie & Fitch.
18