Abercrombie & Fitch 2005 Annual Report Download - page 19
Download and view the complete annual report
Please find page 19 of the 2005 Abercrombie & Fitch annual report below. You can navigate through the pages in the report by either clicking on the pages listed below, or by using the keyword search tool below to find specific information within the annual report.-
 1
1 -
2
-
3
-
4
-
5
-
6
-
7
-
8
-
 9
9 -
 10
10 -
 11
11 -
 12
12 -
 13
13 -
 14
14 -
 15
15 -
 16
16 -
 17
17 -
 18
18 -
 19
19 -
 20
20 -
 21
21 -
 22
22 -
 23
23 -
 24
24 -
 25
25 -
 26
26 -
 27
27 -
 28
28 -
 29
29 -
30
-
31
-
32
-
33
-
34
-
35
-
36
-
37
-
38
-
39
-
40
-
41
-
42
-
43
-
44
-
45
-
46
-
47
-
48
 |
 |

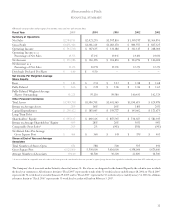
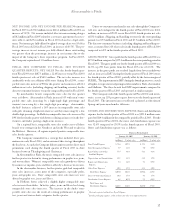
NET INCOME AND NET INCOME PER SHARE Net income
for Fiscal 2005 was $334.0 million versus $216.4 million in Fiscal 2004, an
increase of 54.3%. Net income included after-tax non-recurring charges
of $8.2 million in Fiscal 2005 related to a severance agreement of an exec-
utive officer and $25.6 million in Fiscal 2004 related to a legal settle-
ment. Net income per fully-diluted weighted-average share was $3.66 in
Fiscal 2005 versus $2.28 in Fiscal 2004, an increase of 60.5%. The per-
centage increase in net income per fully-diluted shares outstanding
was greater than the percentage increase in net income due to the
impact of the Company’s share repurchase program. In Fiscal 2005,
the Company repurchased 1.8 million shares.
FISCAL 2004 COMPARED TO FISCAL: 2003 FOURTH
QUARTER RESULTS: NET SALES Net sales for the fourth quar-
ter of Fiscal 2004 were $687.3 million, a 22.6% increase versus Fiscal 2003
fourth quarter net sales of $560.4 million. The net sales increase was
attributable to the net addition of 88 stores during Fiscal 2004, a com-
parable store sales increase of 9% for the quarter and an increase of $11.1
million in net sales (including shipping and handling revenue) for the
direct-to-consumer business versus the comparable period in Fiscal 2003.
By merchandise brand, comparable store sales for the quarter
were as follows: Abercrombie & Fitch increased 4% with men’s com-
parable store sales increasing by a high-single digit percentage and
women’s increasing by a low single-digit percentage. abercrombie,
the kids’ business, achieved a 16% increase in comparable store sales
with girls attaining a high-teen increase and boys increasing by a low
double-digit percentage. In Hollister, comparable store sales increased by
19% for the fourth quarter with bettys realizing an increase in the low-
twenties and dudes posting a high-teens increase.
On a regional basis, comparable store sales results across all three
brands were strongest in the Northeast and in the West and weakest in
the Midwest. However, all regions reported positive comparable store
sales for the quarter.
The Company committed to a strategy that included fewer pro-
motions in early Fiscal 2004, and maintained this strategy throughout
the fiscal year. As such, the Company did not anniversary the direct mail
promotions used during the fourth quarter of Fiscal 2003 to drive
business between Thanksgiving and Christmas.
In Abercrombie & Fitch, the men’s comparable store sales increase
for the quarter was driven by strong performances in graphic tees, jeans,
and woven shirts. Women’s comparable store sales growth was driven
by an increase in polos, jeans and fleece, offset by a decrease in sweaters.
In the abercrombie business, for the quarter, girls had comparable
store sales increases across most of the categories, especially polos,
jeans and graphic tees. Boys’ comparable store sales increases were
driven by graphic tees, jeans and fleece.
In Hollister, bettys achieved a slightly higher comparable store
sales increase than dudes. In bettys, polos, jeans and fleece had strong
comparable store sales increases. The increase in the dudes’ com-
parable store sales was the result of a strong performance in graphic
tees, jeans and woven shirts categories for the quarter.
Direct-to-consumer merchandise net sales through the Company’s
web sites and catalogue for the fourth quarter of Fiscal 2004 were $40.1
million, an increase of 29.4% versus Fiscal 2003 fourth quarter net sales
of $31.0 million. Shipping and handling revenue for the corresponding
periods was $5.5 million in Fiscal 2004 and $3.5 million in Fiscal 2003.
The direct-to-consumer business, including shipping and handling rev-
enue, accounted for 6.6% of net sales in the fourth quarter of Fiscal 2004
compared to 6.2% in the fourth quarter of Fiscal 2003.
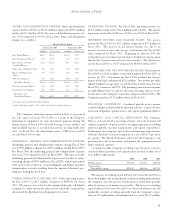
GROSS PROFIT Gross profit for the fourth quarter of Fiscal 2004 was
$455.8 million compared to $355.4 million in the corresponding period in
Fiscal 2003. The gross profit rate for the fourth quarter of Fiscal 2004 was
66.3%, up 290 basis points from the Fiscal 2003 rate of 63.4%. The
increase in the gross profit rate resulted largely from lower markdowns
and an increase in IMU during the fourth quarter of Fiscal 2004 versus
the fourth quarter of Fiscal 2003, partially offset by the lower margin of
RUEHL. The improvement in IMU during the fourth quarter was a result
of higher average unit retail pricing in Abercrombie & Fitch, abercrombie
and Hollister. The three brands had IMU improvements compared to
the fourth quarter of Fiscal 2003 and operated at similar margins.
The Company ended the fourth quarter of Fiscal 2004 with inven-
tories, at cost, up 11% per gross square foot versus the fourth quarter of
Fiscal 2003. The inventory increase reflected a planned acceleration of
Spring and jeans merchandise deliveries.
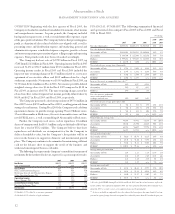
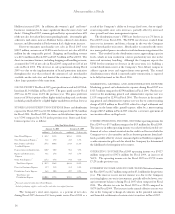
STORES AND DISTRIBUTION EXPENSE Stores and distribution
expense for the fourth quarter of Fiscal 2004 was $223.8 million com-
pared to $164.0 million for the comparable period in Fiscal 2003. For the
fourth quarter of Fiscal 2004, the stores and distribution expense rate
was 32.6% compared to 29.3% in the fourth quarter of Fiscal 2003.
Stores and distribution expense was as follows:
Thirteen Weeks Ended
January 29, 2005 January 31, 2004
(millions) % of net sales (millions) % of net sales
Store Payroll Expense $ 74.6 10.9% $ 45.2 8.1%
Store Management Expense
(1)
7.7 1.1% 5.0 0.9%
Rent, Utilities and Other 57.5 8.4% 51.1 9.1%
Landlord Expense
Depreciation and Amortization 28.1 4.1% 21.8 3.9%
Repairs and Maintenance 8.3 1.2% 5.1 0.9%
Expense
Other Store Expenses
(2)
30.8 4.5% 22.4 4.0%
Total Stores Expense $207.0 30.1% $150.6 26.9%
Direct-to-Consumer Expense 10.6 1.5% 8.3 1.5%
Distribution Center Expense 6.2 0.9% 5.1 0.9%
Total Stores and
Distribution Expense $223.8 32.6% $164.0 29.3%
(1)
Previously reported within Store Payroll Expense.
(2)
Includes packaging, supplies, credit card fees and other store support functions.
Abercrombie &Fitch
17