Abercrombie & Fitch 2005 Annual Report Download - page 13
Download and view the complete annual report
Please find page 13 of the 2005 Abercrombie & Fitch annual report below. You can navigate through the pages in the report by either clicking on the pages listed below, or by using the keyword search tool below to find specific information within the annual report.-
 1
1 -
2
-
 3
3 -
 4
4 -
 5
5 -
 6
6 -
 7
7 -
 8
8 -
 9
9 -
 10
10 -
 11
11 -
 12
12 -
 13
13 -
 14
14 -
 15
15 -
 16
16 -
 17
17 -
 18
18 -
 19
19 -
 20
20 -
 21
21 -
 22
22 -
 23
23 -
24
-
25
-
26
-
27
-
28
-
29
-
30
-
31
-
32
-
33
-
34
-
35
-
36
-
37
-
38
-
39
-
40
-
41
-
42
-
43
-
44
-
45
-
46
-
47
-
48
 |
 |
Abercrombie &Fitch
11
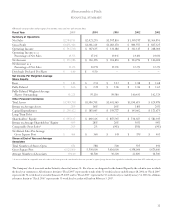
FINANCIAL SUMMARY
(Thousands except per share and per square foot amounts, ratios and store and associate data)
Fiscal Year 2005 2004 2003 2002 2001
Summary of Operations
Net Sales $2,784,711 $2,021,253 $1,707,810 $ 1,595,757 $1,364,853
Gross Profit $1,851,416 $1,341,224 $1,083,170 $ 980,555 $ 817,325
Operating Income $ 542,738 $ 347,635 $ 331,180 $ 312,315 $ 268,004
Operating Income as a
Percentage of Net Sales 19.5% 17.2% 19.4% 19.6% 19.6%
Net Income $ 333,986 $ 216,376 $ 204,830 $ 194,754 $ 166,600
Net Income as a
Percentage of Net Sales 12.0% 10.7% 12.0% 12.2% 12.2%
Dividends Declared Per Share $ 0.60 $ 0.50 – – –
Net Income Per Weighted- Average
Share Results
Basic $ 3.83 $000 2.33 $000 2.12 $00 0 1.98 $00 0 1.68
Fully-Diluted $ 3.66 $0000 2.28 $00 0 2.06 $00 0 1.94 $00 0 1.62
Fully-Diluted Weighted-Average
Shares Outstanding 91,221 95,110$99,580 0100,631 102,524
Other Financial Information
Total Assets $1,789,718 $1,386,791 $1,401,369 $1,190,615 $ 929,978
Return on Average Assets 21% 16% 16% 18% 20%
Capital Expenditures $ 256,422 $0185,065 $0159,777 $ 0145,662 $ 171,673
Long-Term Debt ––– ––
Shareholders’ Equity $ 995,117 $ 669,326 $ 857,765 $ 736,307 $ 582,395
Return on Average Shareholders’ Equity 40% 28% 26% 30% 34%
Comparable Store Sales* 26% 2% (9%) (5%) (9%)
Net Retail Sales Per Average
Gross Square Foot $ 464 $ 00 0360 $000 , 345 $ 379 $ 401
Stores at End of Year and Average
Associates
Total Number of Stores Open 851 788 700 597 491
Gross Square Feet 6,025,000 5,590,000 5,016,000 4,358,000 3,673,000
Average Number of Associates 69,100 48,500 30,200 22,000 16,700
* A store is included in comparable store sales when it has been open as the same brand at least one year and its square footage has not been expanded or reduced by more than 20% within the past year.
The Company’s fiscal year ends on the Saturday closest to January 31. Fiscal years are designated in the Annual Report by the calendar year in which
the fiscal year commences. All references herein to “Fiscal 2005” represent the results of the 52-week fiscal year ended January 28, 2006; to “Fiscal 2004”
represent the 52-week fiscal year ended January 29, 2005; and to “Fiscal 2003” represent the 52-week fiscal year ended January 31, 2004. In addition,
references herein to “Fiscal 2006” represent the 53-week fiscal year that will end on February 3, 2007.