Abercrombie & Fitch 2005 Annual Report Download - page 31
Download and view the complete annual report
Please find page 31 of the 2005 Abercrombie & Fitch annual report below. You can navigate through the pages in the report by either clicking on the pages listed below, or by using the keyword search tool below to find specific information within the annual report.-
 1
1 -
2
-
3
-
4
-
5
-
6
-
7
-
8
-
9
-
10
-
11
-
12
-
13
-
14
-
15
-
16
-
17
-
18
-
19
-
20
-
 21
21 -
 22
22 -
 23
23 -
 24
24 -
 25
25 -
 26
26 -
 27
27 -
 28
28 -
 29
29 -
 30
30 -
 31
31 -
 32
32 -
 33
33 -
 34
34 -
 35
35 -
 36
36 -
 37
37 -
 38
38 -
 39
39 -
 40
40 -
 41
41 -
42
-
43
-
44
-
45
-
46
-
47
-
48
 |
 |

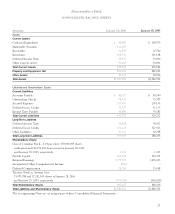
Abercrombie &Fitch
CONSOLIDATED STATEMENTS OF CASH FLOWS
(Thousands)2005 2004 2003
Operating Activities:
Net Income $ 333,986 $ 216,376 $ 204,830
Impact of Other Operating Activities on Cash Flows:
Depreciation and Amortization 124,206 105,814 89,539
Amortization of Deferred Lease Credits (32,527) (32,794) (24,774)
Non-cash Charge for Deferred Compensation 29,347 17,378 11,186
Deferred Taxes (2,099) 3,942 7,126
Non-cash Charge for Asset Impairment 272 1,190 –
Loss on Disposal of Assets 7,386 4,664 –
Lessor Construction Allowances 42,336 55,009 60,649
Changes in Assets and Liabilities:
Inventories (146,314) (34,445) (27,397)
Accounts Payable and Accrued Expenses (2,912) 99,388 15,551
Income Taxes 43,893 1,659 954
Tax Benefit of Stock Option Exercises 52,709 17,308 9,505
Other Assets and Liabilities 3,307 (31,705) (6,355)
Net Cash Provided by Operating Activities 453,590 423,784 340,814
Investing Activities:
Capital Expenditures (256,422) (185,065) (159,777)
Marketable Securities Activity:
Purchases (1,016,986) (4,314,070) (3,849,077)
Proceeds from Sales 605,101 4,778,770 3,771,085
Net Marketable Securities Activity (411,885) 464,700 (77,992)
Net Cash (Used for) Provided by Investing Activities (668,307) 279,635 (237,769)
Financing Activities:
Change in Outstanding Checks 5,164 20,404 4,145
Purchases of Treasury Stock (103,296) (434,658) (115,670)
Stock Option Exercises and Other 77,019 48,927 19,767
Dividends Paid (52,218) (46,438) –
Net Cash Used For Financing Activities (73,331) (411,765) (91,758)
Net (Decrease) Increase in Cash and Equivalents (288,048) 291,654 11,287
Cash and Equivalents, Beginning of Year 338,735 47,081 35,794
Cash and Equivalents, End of Year $ 50,687 $ 338,735 $ 47,081
Significant Non-Cash Investing Activities:
Change in Accrual for Contruction in Progress $ 3,754 $ (15,513) $ 18,589
The accompanying Notes are an integral part of these Consolidated Financial Statements.
29