Abercrombie & Fitch 2005 Annual Report Download - page 14
Download and view the complete annual report
Please find page 14 of the 2005 Abercrombie & Fitch annual report below. You can navigate through the pages in the report by either clicking on the pages listed below, or by using the keyword search tool below to find specific information within the annual report.-
 1
1 -
2
-
3
-
 4
4 -
 5
5 -
 6
6 -
 7
7 -
 8
8 -
 9
9 -
 10
10 -
 11
11 -
 12
12 -
 13
13 -
 14
14 -
 15
15 -
 16
16 -
 17
17 -
 18
18 -
 19
19 -
 20
20 -
 21
21 -
 22
22 -
 23
23 -
 24
24 -
25
-
26
-
27
-
28
-
29
-
30
-
31
-
32
-
33
-
34
-
35
-
36
-
37
-
38
-
39
-
40
-
41
-
42
-
43
-
44
-
45
-
46
-
47
-
48
 |
 |
Abercrombie &Fitch
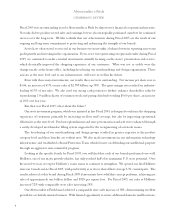
OVERVIEW Beginning with the first quarter of Fiscal 2005, the
Company reclassified its condensed consolidated statements of net income
and comprehensive income. In prior periods, the Company included
buying and occupancy costs as well as certain home office expenses as part
of the gross profit calculation. The Company believes that presenting gross
profit as a function of sales reduced solely by cost of goods sold, as well as
presenting stores and distribution expense and marketing, general and
administrative expense as individual expense categories, provides a clearer
and more transparent representation of gross selling margin and operating
expenses. Prior period results have been reclassified accordingly.
The Company had net sales of $2.785 billion in Fiscal 2005, up
37.8% from $2.021 billion in Fiscal 2004. Operating income for Fiscal 2005
increased 56.1% to $542.7 million from $347.6 million for Fiscal 2004.
Operating income results in Fiscal 2005 and Fiscal 2004 included the
impact of non-recurring charges of $13.5 million related to a severance
agreement of an executive officer and $40.9 million related to a legal
settlement, respectively. Net income was $334.0 million in Fiscal 2005, up
54.3% from $216.4 million in Fiscal 2004. Net income per fully-diluted
weighted-average share was $3.66 for Fiscal 2005 compared to $2.28 in
Fiscal 2004, an increase of 60.5%. The non-recurring charges, net of the
related tax effect, reduced reported net income per fully-diluted share by
$0.09 and $0.27 in Fiscal 2005 and Fiscal 2004, respectively.
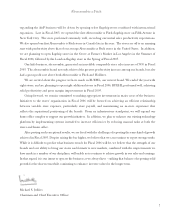
The Company generated cash from operations of $453.6 million in
Fiscal 2005 versus $423.8 million in Fiscal 2004, resulting primarily from
strong sales and income. During Fiscal 2005, the Company used cash from
operations to finance its growth strategy, opening 57 new Hollister stores,
15 new Abercrombie & Fitch stores, five new abercrombie stores and four
new RUEHL stores, as well as remodeling 14 Abercrombie & Fitch stores.
Further, the Company used excess cash to repurchase 1.8 million
shares of common stock for $103.3 million and pay dividends of $0.60 per
share for a total of $52.2 million. The Company believes that share
repurchases and dividends are an important way for the Company to
deliver shareholder value, but the Company’s first priority will be to
invest in the business to support its domestic and international growth
plans. The Company continues to be committed to maintaining sufficient
cash on the balance sheet to support the needs of the business and
withstand unanticipated business volatility.
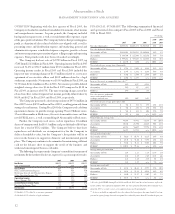
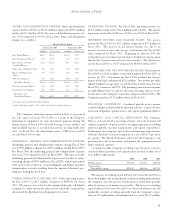
The following data represent the Company’s consolidated statements of
net income for the last three fiscal years, expressed as a percentage of net sales:
2005 2004 2003
Net Sales 100.0% 100.0% 100.0%
Cost of Goods Sold 33.5 33.6 36.6
Gross Profit 66.5 66.4 63.4
Stores and Distribution Expense 35.9 36.5 35.0
Marketing, General and Administrative Expense 11.3(1) 12.9(2) 9.1
Other Operating Income, Net (0.2) (0.2) (0.1)
Operating Income 19.5 17.2 19.4
Interest Income, Net (0.2) (0.3) (0.2)
Income Before Income Taxes 19.7 17.5 19.6
Provision for Income Taxes 7.7 6.8 7.6
Net Income 12.0% 10.7% 12.0%
(1) Includes 0.5% related to a severance agreement.
(2) Includes 2.0% related to a legal settlement.
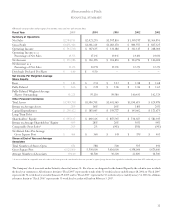
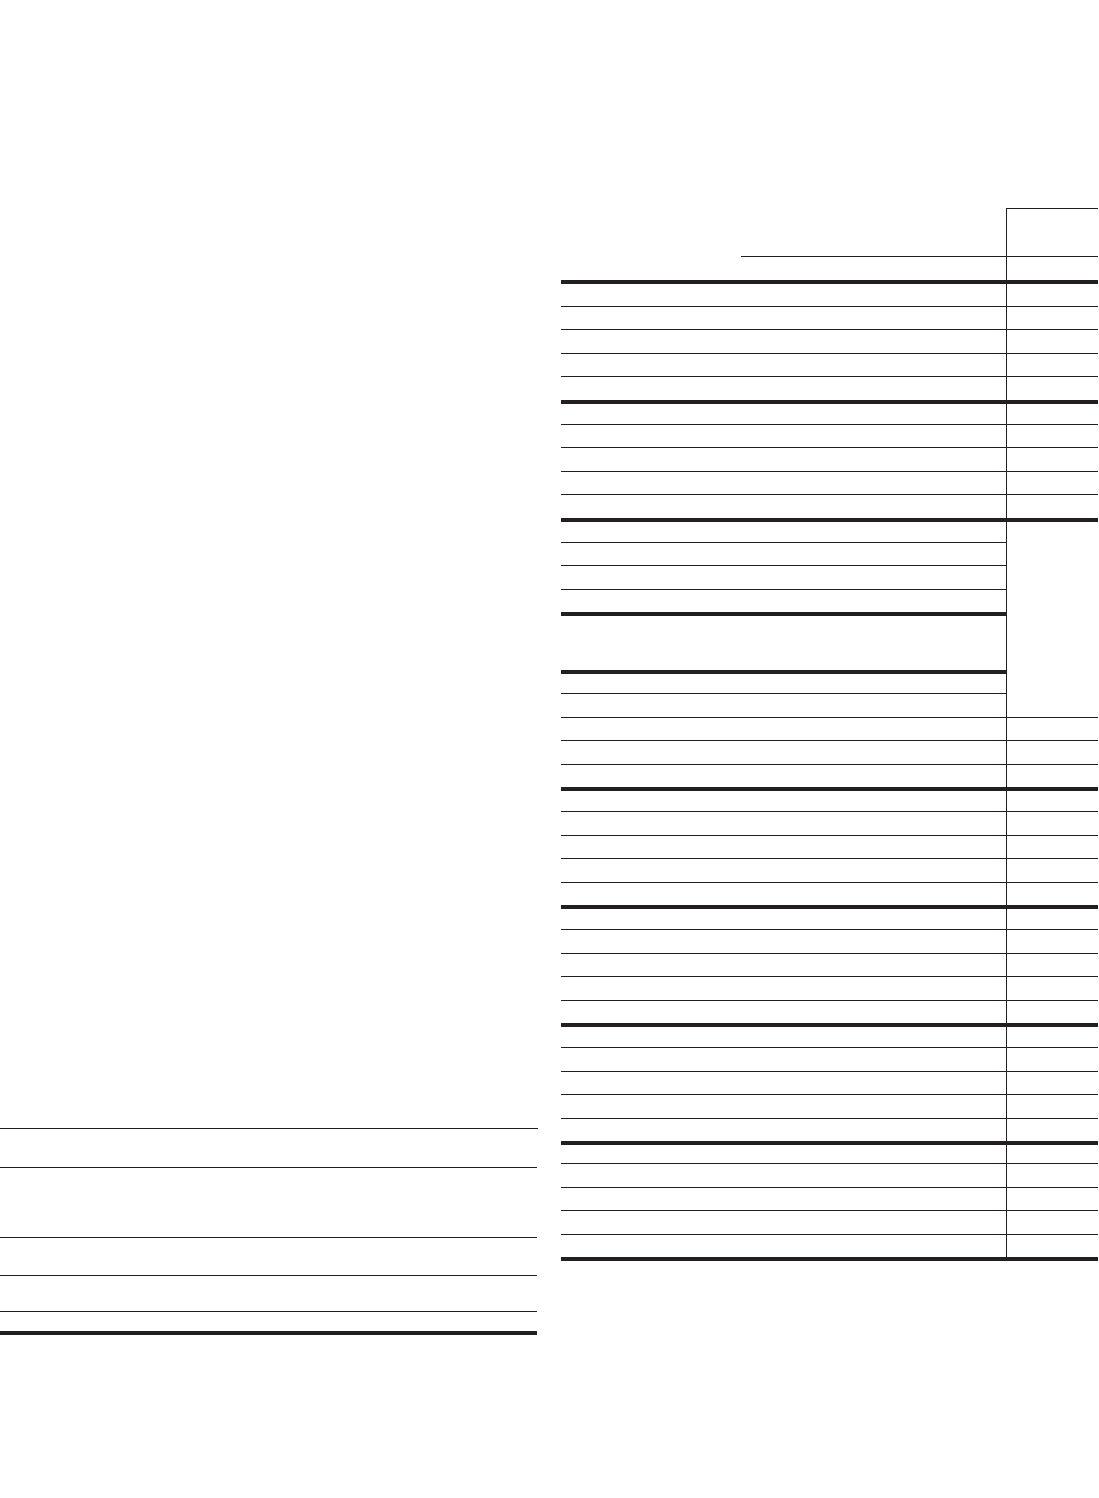
FINANCIAL SUMMARY The following summarized financial
and operational data compares Fiscal 2005 to Fiscal 2004 and Fiscal
2004 to Fiscal 2003:
% Change
2004- 2003-
2005 2004 2003 2005 2004
Net sales (thousands) $2,784,711 $2,021,253 $1,707,810 38% 18%
Net sales by brand (thousands)
Abercrombie & Fitch $1,424,013 $1,210,222 $1,180,646 18% 3%
abercrombie $ 344,938 $ 227,204 $ 212,276 52% 7%
Hollister $ 999,212 $ 579,687 $ 314,888 72% 84%
RUEHL* $ 16,548 $ 4,140 n / a 300% n /a
Net retail sales per average store (thousands)
Abercrombie & Fitch $ 3,784 $ 3,103 $ 3,184 22% (3)%
abercrombie $ 1,957 $ 1,241 $ 1,194 58% 4%
Hollister $ 3,442 $ 2,740 $ 2,594 26% 6%
RUEHL* $ 2,903 $ 1,255 n / a 131% n / a
Increase (decrease) in comparable store sales**
Abercrombie & Fitch 18% (1)% (11)%
abercrombie 54% 1% (6)%
Hollister 29% 13% 7%
Net sales increase attributable
to new and remodeled stores,
catalogue and web sites 12% 16% 16%
Net retail sales per average gross square foot
Abercrombie & Fitch $ 432 $ 352 $ 358 23% (2)%
abercrombie $ 446 $ 282 $ 270 58% 4%
Hollister $ 528 $ 423 $ 404 25% 5%
RUEHL* $ 315 $ 136 n / a 132% n / a
Transactions per average store
Abercrombie & Fitch 49,685 45,941 51,234 8% (10)%
abercrombie 30,356 21,740 22,128 40% (2)%
Hollister 64,913 56,687 57,593 15% (2)%
RUEHL* 26,215 12,913 n /a 103% n / a
Average transaction value
Abercrombie & Fitch $ 76.16 $ 67.54 $ 62.15 13% 9%
abercrombie $ 64.47 $ 57.10 $ 53.98 13% 6%
Hollister $ 53.03 $ 48.33 $ 45.04 10% 7%
RUEHL* $ 110.74 $ 97.16 n /a 14% n / a
Average units per transaction
Abercrombie & Fitch 2.18 2.22 2.24 (2)% 1%
abercrombie 2.66 2.68 2.68 (1)% nm
Hollister 2.21 2.18 2.14 1% 2%
RUEHL* 2.28 2.17 n / a 5% n / a
Average unit retail sold
Abercrombie & Fitch $ 34.94 $ 30.42 $ 27.75 15% 10%
abercrombie $ 24.24 $ 21.31 $ 20.14 14% 6%
Hollister $ 24.00 $ 22.17 $ 21.05 8% 5%
RUEHL* $ 48.57 $ 44.77 n /a 8% n /a
* Net sales for RUEHL during Fiscal 2004 and Fiscal 2005, and the related statistics, reflect the
activity of three stores opened in September 2004, one store opened in December 2004, and four stores
opened in 2005; as a result, year-to-year comparisons may not be meaningful.
** A store is included in comparable store sales when it has been open as the same brand at least one
year and its square footage has not been expanded or reduced by more than 20% within the past year.
12
MANAGEMENT’S DISCUSSION AND ANALYSIS