Abercrombie & Fitch 2005 Annual Report Download - page 21
Download and view the complete annual report
Please find page 21 of the 2005 Abercrombie & Fitch annual report below. You can navigate through the pages in the report by either clicking on the pages listed below, or by using the keyword search tool below to find specific information within the annual report.-
 1
1 -
2
-
3
-
4
-
5
-
6
-
7
-
8
-
9
-
10
-
 11
11 -
 12
12 -
 13
13 -
 14
14 -
 15
15 -
 16
16 -
 17
17 -
 18
18 -
 19
19 -
 20
20 -
 21
21 -
 22
22 -
 23
23 -
 24
24 -
 25
25 -
 26
26 -
 27
27 -
 28
28 -
 29
29 -
 30
30 -
 31
31 -
32
-
33
-
34
-
35
-
36
-
37
-
38
-
39
-
40
-
41
-
42
-
43
-
44
-
45
-
46
-
47
-
48
 |
 |

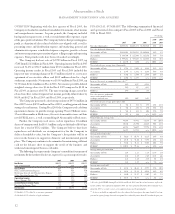
STORES AND DISTRIBUTION EXPENSE Stores and distribution
expense for Fiscal 2004 was $738.2 million compared to $597.4 million
for Fiscal 2003. For Fiscal 2004, the stores and distribution expense rate
was 36.5% compared to 35.0% in Fiscal 2003. Stores and distribution
expense was as follows:
Fifty-Two Weeks Ended
January 29, 2005 January 31, 2004
(millions) % of net sales (millions) % of net sales
Store Payroll Expense $218.4 10.8% $158.5 9.3%
Store Management Expense
(1)
26.7 1.3% 18.5 1.1%
Rent, Utilities and Other 224.4 11.1% 197.5 11.6%
Landlord Expense
Depreciation and Amortization 96.1 4.8% 78.1 4.6%
Repairs and Maintenance 34.7 1.7% 25.6 1.5%
Expense
Other Store Expenses
(2)
84.3 4.2% 66.0 3.9%
Total Stores Expense $684.6 33.9% $544.2 31.9%
Direct-to-Consumer Expense 33.1 1.6% 34.8 2.0%
Distribution Center Expense 20.5 1.0% 18.4 1.1%
Total Stores and
Distribution Expense $738.2 36.5% $597.4 35.0%
(1)
Previously reported within Store Payroll Expense.
(2)
Includes packaging, supplies, credit card fees and other store support functions.
The Company’s total store expense for Fiscal 2004, as a percent of
net sales, increased versus Fiscal 2003 as a result of the Company
beginning to implement its store investment program during the
fourth quarter of Fiscal 2004, offset by leverage of rent, utilities and
other landlord expense as a result of the increase in comparable store
sales. In Fiscal 2004, the distribution center’s UPH increased 10%
over the Fiscal 2003 results.
MARKETING, GENERAL AND ADMINISTRATIVE EXPENSE
Marketing, general and administrative expense during Fiscal 2004
was $259.8 million compared to $155.6 million during Fiscal 2003.
For Fiscal 2004, the marketing, general and administrative expense
rate was 12.9% compared to 9.1% in Fiscal 2003. The increase in the
marketing, general and administrative expense rate was due to a non-
recurring charge of $40.9 million in Fiscal 2004, which represented
0.9% of net sales, related to a legal settlement and higher incentive
compensation accruals resulting from the improved financial per-
formance during the fiscal year.
OTHER OPERATING INCOME, NET Other operating income
for Fiscal 2004 was $4.5 million compared to $979,000 for Fiscal
2003. The increase was related to the amount of the gift card liability
recognized as other income for gift cards for which the Company has
determined the likelihood of redemption to be remote.
OPERATING INCOME For Fiscal 2004, operating income was
$347.6 million compared to $331.2 million for Fiscal 2003. The operat-
ing income rate for Fiscal 2004 was 17.2% versus 19.4% in Fiscal 2003.
INTEREST INCOME AND INCOME TAXES Net interest
income for Fiscal 2004 was $5.2 million compared to $3.7 million in
Fiscal 2003. The increase in net interest income was due to an
increase in interest rates and average cash balances for Fiscal 2004
when compared to Fiscal 2003. Beginning in January 2005, the
Company began investing in taxable money market investments; prior
thereto, the Company invested in tax-free securities. The effective tax
rate for Fiscal 2004 was 38.7% compared to 38.8% for Fiscal 2003.
NET INCOME AND NET INCOME PER SHARE Net income for
Fiscal 2004 was $216.4 million versus $204.8 million for Fiscal 2003, an
increase of 5.7%. Net income for Fiscal 2004 included the after-tax
impact of the legal settlement of $25.6 million. Net income per fully-
diluted weighted-average share was $2.28 in Fiscal 2004 versus $2.06 in
Fiscal 2003, an increase of 10.7%. The percentage increase in net income
per fully-diluted share was greater than the percentage increase in net
income due to the Company’s repurchase program in Fiscal 2004. The
Company repurchased 11.2 million shares in Fiscal 2004.
FINANCIAL CONDITION Continued growth in net income
resulted in higher cash provided by operating activities. A more detailed
discussion of liquidity, capital resources and capital requirements follows.
LIQUIDITY AND CAPITAL RESOURCES The Company
believes cash provided by operating activities and cash on hand will
continue to provide adequate resources to support operations, including
projected growth, seasonal requirements and capital expenditures.
Furthermore, the Company expects that cash from operating activities
will fund dividends currently being paid at a rate of $0.175 per share
per quarter. The Board of Directors will review the Company’s cash
position and results of operations and approve the appropriateness of
future dividend amounts.
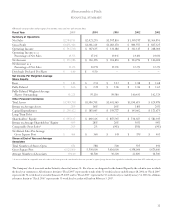
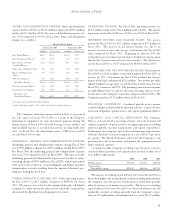
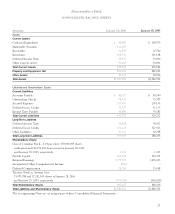
A summary of the Company’s working capital (current assets less
current liabilities) position and capitalization for the last three fiscal
years follows (thousands):
2005 2004 2003
Working capital $455,530 $241,572 $466,970
Capitalization:
Shareholders’ equity $995,117 $669,326 $857,765
The increase in working capital in Fiscal 2005 versus Fiscal 2004 was
the result of higher cash and marketable securities resulting primarily from
the Company’s net sales increase and the increase in inventory, partially
offset by an increase in income taxes payable. The decrease in working
capital in Fiscal 2004 versus Fiscal 2003 was the result of lower cash and
marketable securities resulting primarily from the Company’s repur-
chase of 11.2 million shares of common stock at a cost of $434.7 million.
Abercrombie &Fitch
19