Abercrombie & Fitch 2005 Annual Report Download - page 18
Download and view the complete annual report
Please find page 18 of the 2005 Abercrombie & Fitch annual report below. You can navigate through the pages in the report by either clicking on the pages listed below, or by using the keyword search tool below to find specific information within the annual report.-
 1
1 -
2
-
3
-
4
-
5
-
6
-
7
-
 8
8 -
 9
9 -
 10
10 -
 11
11 -
 12
12 -
 13
13 -
 14
14 -
 15
15 -
 16
16 -
 17
17 -
 18
18 -
 19
19 -
 20
20 -
 21
21 -
 22
22 -
 23
23 -
 24
24 -
 25
25 -
 26
26 -
 27
27 -
 28
28 -
29
-
30
-
31
-
32
-
33
-
34
-
35
-
36
-
37
-
38
-
39
-
40
-
41
-
42
-
43
-
44
-
45
-
46
-
47
-
48
 |
 |

Abercrombie &Fitch
Hollister increased 29%. In addition, the women’s, girls’ and bettys’
businesses continued to be more significant than the men’s, boys’ and
dudes’. During Fiscal 2005, women, girls and bettys represented over 60%
of the net sales for each of their corresponding brands. abercrombie girls
achieved a mid-sixties increase, Hollister bettys achieved a low-thirties
increase and Abercrombie & Fitch women had a high-teens increase.
Direct-to-consumer merchandise net sales in Fiscal 2005 were
$122.5 million, an increase of 10.8% versus last year’s net sales of $110.6
million for the comparable period. Shipping and handling revenue
was $17.6 million in Fiscal 2005 and $15.7 million in Fiscal 2004. The
direct-to-consumer business, including shipping and handling revenue,
accounted for 5.0% of net sales in Fiscal 2005 compared to 6.2% of net
sales in Fiscal 2004. The decrease in sales penetration during Fiscal
2005 was due to the implementation of brand protection initiatives
throughout the year that reduced the amount of sale merchandise
available on the web sites and limited the customer’s ability to pur-
chase large quantities of the same item.
GROSS PROFIT For Fiscal 2005, gross profit increased to $1.851 bil-
lion from $1.341 billion in Fiscal 2004. The gross profit rate for Fiscal
2005 was 66.5% versus 66.4% the previous year. The gross profit rate
increase of 10 basis points reflects higher initial markup and a reduction
in shrink, partially offset by a slightly higher markdown rate than last year.
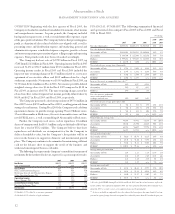
STORES AND DISTRIBUTION EXPENSE Stores and distribution
expense for Fiscal 2005 was $1.001 billion compared to $738.2 million
for Fiscal 2004. For Fiscal 2005, the stores and distribution expense rate
was 35.9% compared to 36.5% in the previous year. Stores and distri-
bution expense was as follows:
Fifty-Two Weeks Ended
January 28, 2006 January 29, 2005
(millions) % of net sales (millions) % of net sales
Store Payroll Expense $ 338.2 12.1% $218.4 10.8%
Store Management Expense
(1)
41.1 1.5% 26.7 1.3%
Rent, Utilities and Other 277.2 10.0% 224.4 11.1%
Landlord Expense
Depreciation and Amortization 110.7 4.0% 96.1 4.8%
Repairs and Maintenance 43.1 1.5% 34.7 1.7%
Expense
Other Store Expenses
(2)
125.2 4.5% 84.3 4.2%
Total Stores Expense $ 935.5 33.6% $684.6 33.9%
Direct-to-Consumer Expense 38.5 1.4% 33.1 1.6%
Distribution Center Expense 26.8 1.0% 20.5 1.0%
Total Stores and
Distribution Expense $1,000.8 35.9% $738.2 36.5%
(1)
Previously reported within Store Payroll Expense.
(2)
Includes packaging, supplies, credit card fees and other store support functions.
The Company’s total store expense, as a percent of net sales,
during Fiscal 2005 decreased 30 basis points versus Fiscal 2004 as a
result of the Company’s ability to leverage fixed costs, due to signif-
icant comparable store sales increases, partially offset by increased
store payroll and store management expense.
The distribution center’s UPH rate for the year was 7% lower in
Fiscal 2005 versus Fiscal 2004. The UPH rate decrease resulted from
increases in inventory and from a change in the way the Company
flowed merchandise to its stores. Merchandise was routed to the stores
in a more gradual process in order to avoid stockroom congestion at the
stores. This resulted in the distribution center approaching capacity
levels, which in turn resulted in a lower productivity rate due to the
increased inventory handling. Although the Company expects the
UPH level to continue to decrease in the near term, it is building a
second distribution center at the Company’s New Albany campus to
address capacity issues and support future store growth. The second
distribution center, which is currently under construction, is expected
to be fully functional in late Fiscal 2006.
MARKETING, GENERAL AND ADMINISTRATIVE EXPENSE
Marketing, general and administrative expense during Fiscal 2005 was
$313.5 million compared to $259.8 million in Fiscal 2004. For the cur-
rent year, the marketing, general and administrative expense rate was
11.3% compared to 12.9% in Fiscal 2004. The decrease in the market-
ing, general and administrative expense rate was due to a non-recurring
charge of $40.9 million in Fiscal 2004 related to a legal settlement and
leverage in the home office payroll expense, offset by a non-recurring
charge of $13.5 million in Fiscal 2005 related to a severance agreement of
an executive officer and legal costs.
OTHER OPERATING INCOME, NET Other operating income for
Fiscal 2005 was $5.5 million compared to $4.5 million for Fiscal 2004.
The increase in other operating income was related to the favorable set-
tlement of a class action lawsuit related to credit card fees in which the
Company was a class member and lease buyout payments from land-
lords, partially offset by a lower amount of gift card liability recognized
as other income for gift cards for which the Company has determined
the likelihood of redemption to be remote.
OPERATING INCOME Fiscal 2005 operating income was $542.7
million compared to $347.6 million for Fiscal 2004, an increase of
56.1%. The operating income rate for Fiscal 2005 was 19.5% versus
17.2% in the previous year.
INTEREST INCOME AND INCOME TAXES Net interest income
for Fiscal 2005 was $6.7 million compared to $5.2 million for the previous
year. The increase in net interest income was due to the Company
receiving higher rates on its investments, partially offset by lower aver-
age investment balances during Fiscal 2005 when compared to Fiscal
2004. The effective tax rate for Fiscal 2005 was 39.2% compared to
38.7% for Fiscal 2004. The increase in the annual effective tax rate was
due to the Company’s change of estimates in the potential outcomes
and favorable settlements of certain state tax matters in Fiscal 2005.
16