Westjet 2014 Annual Report Download - page 79
Download and view the complete annual report
Please find page 79 of the 2014 Westjet annual report below. You can navigate through the pages in the report by either clicking on the pages listed below, or by using the keyword search tool below to find specific information within the annual report.-
 1
1 -
2
-
3
-
4
-
5
-
6
-
7
-
8
-
9
-
10
-
11
-
12
-
13
-
14
-
15
-
16
-
17
-
18
-
19
-
20
-
21
-
22
-
23
-
24
-
25
-
26
-
27
-
28
-
29
-
30
-
31
-
32
-
33
-
34
-
35
-
36
-
37
-
38
-
39
-
40
-
41
-
42
-
43
-
44
-
45
-
46
-
47
-
48
-
49
-
50
-
51
-
52
-
53
-
54
-
55
-
56
-
57
-
58
-
59
-
60
-
61
-
62
-
63
-
64
-
65
-
66
-
67
-
68
-
 69
69 -
 70
70 -
 71
71 -
 72
72 -
 73
73 -
 74
74 -
 75
75 -
 76
76 -
 77
77 -
 78
78 -
 79
79 -
 80
80 -
 81
81 -
 82
82 -
 83
83 -
 84
84 -
 85
85 -
 86
86 -
 87
87 -
 88
88 -
 89
89 -
90
-
91
 |
 |
Notes to Consolidated Financial Statements
As at and for the years ended December 31, 2014 and 2013
(Stated in thousands of Canadian dollars, except percentage, ratio, share and per share amounts)
WestJet Annual Report 2014 │ 77
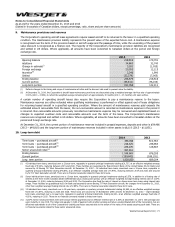
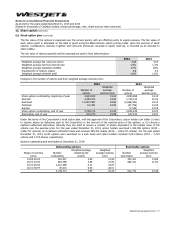
12. Share capital (continued)
(c) Stock option plan (continued)
The fair value of the options is expensed over the service period, with an offsetting entry to equity reserves. The fair value of
each option grant is estimated on the date of grant using the Black-Scholes option pricing model. Upon the exercise of stock
options, consideration received, together with amounts previously recorded in equity reserves, is recorded as an increase to
share capital.
The fair value of options granted and the assumptions used in their determination:
2014 2013
Weighted average fair value per option
4.55
4.54
Weighted average risk-free interest rate 1.5% 1.3%
Weighted average expected volatility 27% 29%
Expected life of options (years)
3.8
3.9
Weighted average dividend yield 1.6% 1.6%
Changes in the number of options and their weighted average exercise price:
2014 2013
Number of
options
Weighted
average
exercise price Number of
options
Weighted
average
exercise price
Stock options outstanding, beginning of year 2,834,639 19.20 3,850,898 14.45
Granted 2,353,474 23.94 1,722,013 21.92
Exercised (1,447,250) 18.82 (2,668,440) 14.24
Forfeited
(2,149)
22.90
(67,796)
14.05
Expired - - (2,036) 13.55
Stock options outstanding, end of year
3,738,714
22.33
2,834,639
19.20
Exercisable, end of year 912,772 19.38 637,292 14.57
Under the terms of the Corporation's stock option plan, with the approval of the Corporation, option holders can either (i) elect
to receive shares by delivering cash to the Corporation in the amount of the exercise price of the options, or (ii) choose a
cashless settlement alternative, whereby they can elect to receive a number of shares equivalent to the market value of the
options over the exercise price. For the year ended December 31, 2014, option holders exercised 1,442,006 options (2013 –
2,660,717 options) on a cashless settlement basis and received 495,354 shares (2013 – 1,064,373 shares). For the year ended
December 31, 2014, 5,244 options were exercised on a cash basis and option holders received 5,244 shares (2013 – 7,723
options and 7,723 shares, respectively).
Options outstanding and exercisable at December 31, 2014:
Outstanding options Exercisable options
Range of exercise
prices Number
outstanding
Weighted average
remaining life
(years)
Weighted
average exercise
price Number
exercisable
Weighted
average exercise
price
13.85-20.00
502,547
2.99
14.94
330,361
14.89
20.01-23.00 883,768 3.66 21.92 582,411 21.92
23.01-26.00 2,312,389 4.12 23.87 - -
26.01-30.97
40,010
6.50
28.01
-
-
3,738,714 3.89 22.33 912,772 19.38