Westjet 2014 Annual Report Download - page 13
Download and view the complete annual report
Please find page 13 of the 2014 Westjet annual report below. You can navigate through the pages in the report by either clicking on the pages listed below, or by using the keyword search tool below to find specific information within the annual report.-
 1
1 -
2
-
 3
3 -
 4
4 -
 5
5 -
 6
6 -
 7
7 -
 8
8 -
 9
9 -
 10
10 -
 11
11 -
 12
12 -
 13
13 -
 14
14 -
 15
15 -
 16
16 -
 17
17 -
 18
18 -
 19
19 -
 20
20 -
 21
21 -
 22
22 -
 23
23 -
24
-
25
-
26
-
27
-
28
-
29
-
30
-
31
-
32
-
33
-
34
-
35
-
36
-
37
-
38
-
39
-
40
-
41
-
42
-
43
-
44
-
45
-
46
-
47
-
48
-
49
-
50
-
51
-
52
-
53
-
54
-
55
-
56
-
57
-
58
-
59
-
60
-
61
-
62
-
63
-
64
-
65
-
66
-
67
-
68
-
69
-
70
-
71
-
72
-
73
-
74
-
75
-
76
-
77
-
78
-
79
-
80
-
81
-
82
-
83
-
84
-
85
-
86
-
87
-
88
-
89
-
90
-
91
 |
 |
WestJet Annual Report 2014│ 11
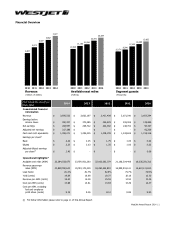
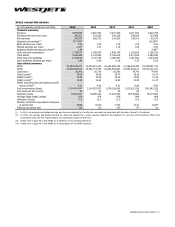
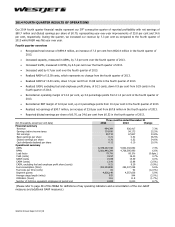
Select annual information
($ in thousands, except per unit data)
2014
2013
2012
2011
2010
Financial summary
Revenue 3,976,552 3,662,197 3,427,409 3,071,540 2,607,294
Earnings before income taxes
390,307
372,085
340,229
208,006
133,465
Net earnings 283,957 268,722 242,392 148,702 90,197
Adjusted net earnings
(iv)
317,188
(i)
− − − 92,269
(ii)
Basic earnings per share
2.22
2.05
1.79
1.06
0.62
Diluted earnings per share 2.20(i) 2.03 1.78 1.06 0.62
Adjusted diluted earnings per share
(iv)
2.46 − − − 0.66
(ii)
Cash and cash equivalents
1,358,071
1,256,005
1,408,199
1,243,605
1,159,316
Total assets 4,646,433 4,143,463 3,746,615 3,473,678 3,383,980
Total long-term liabilities 1,530,630 1,147,163 1,086,457 1,161,604 1,240,285
Cash dividends declared per share
0.48
0.40
0.28
0.20
0.05
Operational summary
ASMs 25,584,033,077 23,970,921,260 22,063,583,754 21,186,304,409 19,535,291,313
RPMs
20,828,992,613
19,591,173,039
18,262,554,881
16,890,941,121
15,613,121,610
Load factor 81.4% 81.7% 82.8% 79.7% 79.9%
Yield (cents)
(iii)
19.09 18.69 18.77 18.18 16.70
RASM (cents)(iii)
15.54
15.28
15.53
14.50
13.35
CASM (cents)(iii) 13.68 13.61 13.83 13.29 12.37
CASM, excluding fuel and employee profit
share (cents)(iv) 9.15 9.06 9.12 8.85 8.80
Fuel consumption (litres) 1,214,001,002 1,144,937,872 1,079,108,614 1,027,821,192 950,341,292
Fuel costs per litre (cents) 90 91 92 89 71
Segment guests
19,651,977
18,485,144
17,423,352
16,040,682
15,173,581
Average stage length (miles) 936 976 978 984 968
Utilization (hours)
11.8
12.0 11.9 11.8 11.6
Number of full-time equivalent employees
at period end 8,698 8,000 7,742 7,141 6,877
Fleet size at period end 122 113 100 97 91
(i) In 2014, net earnings and diluted earnings per share are adjusted for the after-tax non-cash loss associated with the sale of aircraft to Southwest.
(ii) In 2010, net earnings and diluted earnings per share are adjusted for a salary expense related to the departure of a previous Chief Executive Officer and
incremental costs from the implementation of a reservation system at that time.
(iii) Please refer to page 48 of this MD&A for a definition of key operating indicators.
(iv) Please refer to page 48 of this MD&A for a reconciliation of non-GAAP measures.