Westjet 2014 Annual Report Download - page 10
Download and view the complete annual report
Please find page 10 of the 2014 Westjet annual report below. You can navigate through the pages in the report by either clicking on the pages listed below, or by using the keyword search tool below to find specific information within the annual report.-
 1
1 -
 2
2 -
 3
3 -
 4
4 -
 5
5 -
 6
6 -
 7
7 -
 8
8 -
 9
9 -
 10
10 -
 11
11 -
 12
12 -
 13
13 -
 14
14 -
 15
15 -
 16
16 -
 17
17 -
 18
18 -
 19
19 -
 20
20 -
 21
21 -
22
-
23
-
24
-
25
-
26
-
27
-
28
-
29
-
30
-
31
-
32
-
33
-
34
-
35
-
36
-
37
-
38
-
39
-
40
-
41
-
42
-
43
-
44
-
45
-
46
-
47
-
48
-
49
-
50
-
51
-
52
-
53
-
54
-
55
-
56
-
57
-
58
-
59
-
60
-
61
-
62
-
63
-
64
-
65
-
66
-
67
-
68
-
69
-
70
-
71
-
72
-
73
-
74
-
75
-
76
-
77
-
78
-
79
-
80
-
81
-
82
-
83
-
84
-
85
-
86
-
87
-
88
-
89
-
90
-
91
 |
 |

WestJet Annual Report 2014│8
ANNUAL OVERVIEW
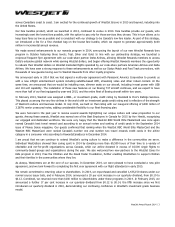
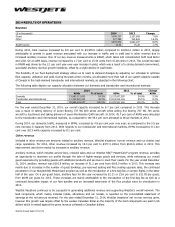
We are very pleased with the overall results we achieved in 2014. Our record annual net earnings of $284.0 million and
diluted earnings per share of $2.20 marked the tenth consecutive year of annual profitability and is the eighteenth time we
have reported an annual profit in our 19-years of reporting. Included in net earnings for the year ended December 31, 2014,
is an after-tax $33.2 million non-cash loss associated with 10 aircraft being classified to assets held for sale in our
consolidated statement of financial position (the non-cash loss). Of these 10 aircraft sold to Southwest Airlines (Southwest)
five were physically delivered in the fourth quarter of 2014. Excluding this non-cash loss, for the year ended December 31,
2014, our adjusted net earnings are $317.2 million, an increase of 18.0 per cent from the same period in 2013, and our
adjusted diluted earnings per share are $2.46. During 2014, revenue increased by 8.6 per cent to end the year at $4.0 billion
driven mainly by an increase in traffic of 6.3 per cent and improvements in yield, year over year.
In 2014, we completed our first transatlantic flights, we continued to expand our overall network and we grew our airline
partnerships. We also introduced various service enhancements in order to improve our guests’ overall experience. We
launched a new WestJet Rewards tiers program and we introduced a price-drop guarantee on flights and vacation packages.
We also introduced a fee for the first checked bag on Econo fares, we were successful at expanding our sources of financing
through a new credit facility and our inaugural bond offering, we achieved our previously disclosed goal of $100 million of
future annual cost savings in 2014, and, we continued to remain focused on reducing future costs under our business
transformation initiative. Finally, in December 2014 we reached a new agreement with our pilots.
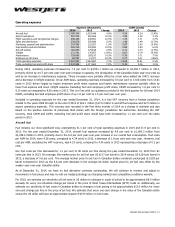
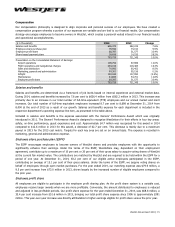
We distributed approximately $100.7 million to our shareholders through our dividend and share buy-back programs in 2014.
Since these programs began in 2010, we have returned over five hundred million dollars to our shareholders. Our 12-month
ROIC of 14.3 per cent at 2014 year-end, which excludes the non-cash loss associated with the sale of 10 aircraft to
Southwest, continues to surpass our goal of a sustainable 12 per cent ROIC and represents a slight improvement of 0.4
percentage points as compared to our 2013 year-end ROIC of 13.9 per cent.
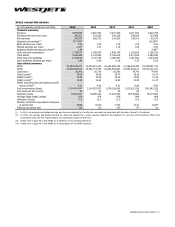
2014 Summary
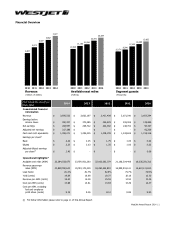
• Recognized total revenue of $3,976.6 million, an increase of 8.6 per cent from $3,662.2 million in 2013.
• Increased capacity, measured in ASMs, by 6.7 per cent over 2013.
• Increased traffic, measured in revenue passenger miles (RPMs), by 6.3 per cent over 2013.
• Increased yield by 2.1 per cent over 2013.
• Realized revenue per available seat mile (RASM) of 15.54 cents, up 1.7 per cent from 15.28 cents in 2013.
• Realized cost per available seat mile (CASM) of 13.68 cents, up 0.5 per cent from 13.61 cents in 2013.
• Realized CASM, excluding fuel and employee profit share, of 9.15 cents, up 1.0 per cent from 9.06 cents in 2013.
• Recorded an operating margin of 12.0 per cent, up 1.1 percentage points from 10.9 per cent in 2013.
• Recorded an EBT margin of 9.8 per cent, down 0.4 percentage points from 10.2 per cent in 2013. Adjusted for the
pre-tax non-cash loss, EBT margin was 11.0 per cent, up 0.8 percentage points from 2013.
• Reported net earnings of $284.0 million, an increase of 5.7 per cent from $268.7 million in 2013. Adjusted for the
non-cash loss, net earnings is $317.2 million, an increase of 18.0 per cent from 2013.
• Reported diluted earnings per share of $2.20, an increase of 8.4 per cent from $2.03 per share in 2013. Adjusted for
the non-cash loss, diluted earnings per share is $2.46, an increase of 21.2 per cent from 2013.
(Please refer to page 48 of this MD&A for a reconciliation of non-GAAP measures and additional GAAP measures)