Westjet 2014 Annual Report Download - page 51
Download and view the complete annual report
Please find page 51 of the 2014 Westjet annual report below. You can navigate through the pages in the report by either clicking on the pages listed below, or by using the keyword search tool below to find specific information within the annual report.-
 1
1 -
2
-
3
-
4
-
5
-
6
-
7
-
8
-
9
-
10
-
11
-
12
-
13
-
14
-
15
-
16
-
17
-
18
-
19
-
20
-
21
-
22
-
23
-
24
-
25
-
26
-
27
-
28
-
29
-
30
-
31
-
32
-
33
-
34
-
35
-
36
-
37
-
38
-
39
-
40
-
 41
41 -
 42
42 -
 43
43 -
 44
44 -
 45
45 -
 46
46 -
 47
47 -
 48
48 -
 49
49 -
 50
50 -
 51
51 -
 52
52 -
 53
53 -
 54
54 -
 55
55 -
 56
56 -
 57
57 -
 58
58 -
 59
59 -
 60
60 -
 61
61 -
62
-
63
-
64
-
65
-
66
-
67
-
68
-
69
-
70
-
71
-
72
-
73
-
74
-
75
-
76
-
77
-
78
-
79
-
80
-
81
-
82
-
83
-
84
-
85
-
86
-
87
-
88
-
89
-
90
-
91
 |
 |
WestJet Annual Report 2014│ 49
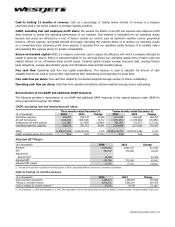
Cash to trailing 12 months of revenue: Cash as a percentage of trailing twelve months of revenue is a measure
commonly used in the airline industry to compare liquidity positions.
CASM, excluding fuel and employee profit share: We exclude the effects of aircraft fuel expense and employee profit
share expense to assess the operating performance of our business. Fuel expense is excluded from our operating results
because fuel prices are affected by a host of factors outside our control, such as significant weather events, geopolitical
tensions, refinery capacity, and global demand and supply. Excluding this expense allows us to analyze our operating results
on a comparable basis. Employee profit share expense is excluded from our operating results because of its variable nature
and excluding this expense allows for greater comparability.
Return on invested capital: ROIC is a measure commonly used to assess the efficiency with which a company allocates its
capital to generate returns. Return is calculated based on our earnings before tax, excluding special items, finance costs and
implied interest on our off-balance-sheet aircraft leases. Invested capital includes average long-term debt, average finance
lease obligations, average shareholders’ equity and off-balance-sheet aircraft operating leases.
Free cash flow: Operating cash flow less capital expenditures. This measure is used to calculate the amount of cash
available that can be used to pursue other opportunities after maintaining and expanding the asset base.
Free cash flow per share: Free cash flow divided by the diluted weighted average number of shares outstanding.
Operating cash flow per share: Cash flow from operations divided by diluted weighted average shares outstanding.
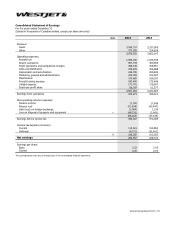
Reconciliation of non-GAAP and additional GAAP measures
The following provides a reconciliation of non-GAAP and additional GAAP measures to the nearest measure under GAAP for
items presented throughout this MD&A.
CASM, excluding fuel and employee profit share
Three months ended December 31 Twelve months ended December 31
($ in thousands)
2014
2013
Change
2014
2013
Change
Operating expenses 854,787 824,742 30,045 3,501,081 3,262,687 238,394
Aircraft fuel expense (243,816) (260,528) 16,712 (1,090,330) (1,039,448) (50,882)
Employee profit share expense
(23,399)
(12,463)
(10,936)
(68,787)
(51,577)
(17,210)
Operating expenses, adjusted
587,572
551,751
35,821
2,341,964
2,171,662
170,302
ASMs
6,378,247,018
5,942,032,692 7.3%
25,584,033,077
23,970,921,260 6.7%
CASM, excluding above items (cents)
9.21
9.29
(0.9%)
9.15
9.06
1.0%
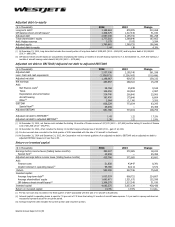
Adjusted EBT Margin
($ in thousands) 2014 2013 Change
Revenue
3,976,552 3,662,197 314,355
EBT 390,307 372,085 18,222
Adjusted for:
Special item
(i)
45,459 -
45,459
Adjusted EBT 435,766 372,085 63,681
Adjusted EBT margin
11.0% 10.2% 0.8 pts.
(i) Pre-tax non-cash loss recorded in the third quarter of 2014, associated with the sale of the 10 aircraft to Southwest.
Cash to trailing 12 months revenue
($ in thousands)
2014
2013
Change
Cash and cash equivalents
1,358,071
1,256,005
102,066
Trailing 12 months revenue 3,976,552 3,662,197 314,355
Cash to trailing 12 months revenue (i)
34.2%
34.3%
0.1 pts.
(i) At December 31, 2014 and December 31, 2013, the Corporation met its internal guideline of cash to trailing 12 months revenue of approximately 30 per cent.