Westjet 2014 Annual Report Download - page 53
Download and view the complete annual report
Please find page 53 of the 2014 Westjet annual report below. You can navigate through the pages in the report by either clicking on the pages listed below, or by using the keyword search tool below to find specific information within the annual report.-
 1
1 -
2
-
3
-
4
-
5
-
6
-
7
-
8
-
9
-
10
-
11
-
12
-
13
-
14
-
15
-
16
-
17
-
18
-
19
-
20
-
21
-
22
-
23
-
24
-
25
-
26
-
27
-
28
-
29
-
30
-
31
-
32
-
33
-
34
-
35
-
36
-
37
-
38
-
39
-
40
-
41
-
42
-
 43
43 -
 44
44 -
 45
45 -
 46
46 -
 47
47 -
 48
48 -
 49
49 -
 50
50 -
 51
51 -
 52
52 -
 53
53 -
 54
54 -
 55
55 -
 56
56 -
 57
57 -
 58
58 -
 59
59 -
 60
60 -
 61
61 -
 62
62 -
 63
63 -
64
-
65
-
66
-
67
-
68
-
69
-
70
-
71
-
72
-
73
-
74
-
75
-
76
-
77
-
78
-
79
-
80
-
81
-
82
-
83
-
84
-
85
-
86
-
87
-
88
-
89
-
90
-
91
 |
 |

WestJet Annual Report 2014│ 51
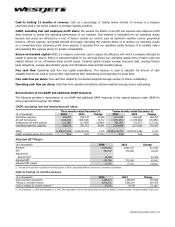
(iv) Off-balance-sheet aircraft leases are calculated by multiplying the trailing 12 months of aircraft leasing expense by 7.5. At December 31, 2014, the trailing 12
months of aircraft leasing costs totaled $182,450 (2013 – $175,646).
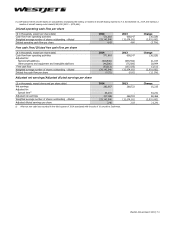
Diluted operating cash flow per share
($ in thousands, except per share data)
2014
2013
Change
Cash flow from operating activities
571,618
608,147
(36,529)
Weighted average number of shares outstanding - diluted
129,142,940
132,074,002
(2,931,062)
Diluted operating cash flow per share
4.43
4.60
(3.7%)
Free cash flow/Diluted free cash flow per share
($ in thousands, except per share data) 2014 2013 Change
Cash flow from operating activities 571,618 608,147 (36,529)
Adjusted for:
Net Aircraft additions
(618,545)
(639,592)
21,047
Other property and equipment and intangible additions (46,586) (75,580) 28,994
Free cash flow (93,513) (107,025) 13,512
Weighted average number of shares outstanding - diluted
129,142,940
132,074,002
(2,931,062)
Diluted free cash flow per share (0.72) (0.81) (11.1%)
Adjusted net earnings/Adjusted diluted earnings per share
($ in thousands, except share and per share data) 2014 2013 Change
Net earnings
283,957 268,722 15,235
Adjusted for:
Special item(i) 33,231 -
33,231
Adjusted net earnings
317,188 268,722 48,466
Weighted average number of shares outstanding - diluted 129,142,940 132,074,002 (2,931,062)
Adjusted diluted earnings per share 2.46 2.03 21.2%
(i) After-tax non-cash loss recorded in the third quarter of 2014 associated with the sale of 10 aircraft to Southwest.