Westjet 2014 Annual Report Download - page 24
Download and view the complete annual report
Please find page 24 of the 2014 Westjet annual report below. You can navigate through the pages in the report by either clicking on the pages listed below, or by using the keyword search tool below to find specific information within the annual report.-
 1
1 -
2
-
3
-
4
-
5
-
6
-
7
-
8
-
9
-
10
-
11
-
12
-
13
-
 14
14 -
 15
15 -
 16
16 -
 17
17 -
 18
18 -
 19
19 -
 20
20 -
 21
21 -
 22
22 -
 23
23 -
 24
24 -
 25
25 -
 26
26 -
 27
27 -
 28
28 -
 29
29 -
 30
30 -
 31
31 -
 32
32 -
 33
33 -
 34
34 -
35
-
36
-
37
-
38
-
39
-
40
-
41
-
42
-
43
-
44
-
45
-
46
-
47
-
48
-
49
-
50
-
51
-
52
-
53
-
54
-
55
-
56
-
57
-
58
-
59
-
60
-
61
-
62
-
63
-
64
-
65
-
66
-
67
-
68
-
69
-
70
-
71
-
72
-
73
-
74
-
75
-
76
-
77
-
78
-
79
-
80
-
81
-
82
-
83
-
84
-
85
-
86
-
87
-
88
-
89
-
90
-
91
 |
 |

WestJet Annual Report 2014│22
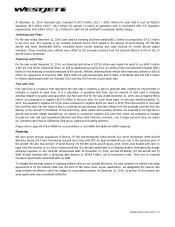
LIQUIDITY AND CAPITAL RESOURCES
Liquidity
As the airline industry has relatively high fixed costs, and as such is highly sensitive to unpredictable circumstances,
maintaining a strong financial position is imperative to an airline’s success. Our consistently strong financial results enable us
to maintain a healthy balance sheet. We completed 2014 with a cash and cash equivalents balance of $1,358.1 million,
compared to $1,256.0 million at December 31, 2013. The increase in our cash position was a result of cash flow from
operations of $571.6 million driven by strong earnings, and cash flow from financing activities of $175.0 million mainly driven
by our $400.0 million 3.287 per cent Senior Unsecured Notes issued in July 2014 partially offset by debt repayments,
described further under the
Financing
heading below. These inflows were partially offset by capital expenditures for aircraft
and other equipment of $665.1 million and a combined total of $100.7 million spent on our dividend and share buy-back
programs.
Part of our cash and cash equivalents balance relates to cash collected with respect to advance ticket sales, for which the
balance at December 31, 2014, was $575.8 million, an increase of 4.5 per cent from $551.0 million at December 31, 2013. We
have cash and cash equivalents on hand to have sufficient liquidity to meet these liabilities, under both normal and stressed
conditions. At December 31, 2014, we had cash on hand of 2.36 (2013 – 2.28) times our advance ticket sales balance.
We monitor capital on a number of measures, including cash to trailing 12 months (TTM) revenue ratio, adjusted debt-to-
equity ratio and adjusted net debt to EBITDAR ratio. As of December 31, 2014, our cash to TTM revenue ratio was 34.2 per
cent, compared to 34.3 per cent at December 31, 2013, relatively unchanged. This is in-line with our expectations and is the
result of an increase in cash and cash equivalents from strong earnings, an increase in our revenues and the issuance of our
Senior Unsecured Notes in July 2014. In addition to our cash and cash equivalents, as of December 31, 2014, we have
available the undrawn portion of our revolving credit facility which is $250.0 million and expires in June 2017. Our adjusted
debt-to-equity ratio of 1.44, and our adjusted net debt to EBITDAR ratio of 1.43 at December 31, 2014, have both increased
from 1.38 and 1.22, respectively, at December 31, 2013. Excluding the pre-tax $45.5 million non-cash loss, our adjusted net
debt to adjusted EBITDAR ratio is 1.36 at December 31, 2014. These increases are in line with our expectations and are due
to increased debt levels associated with the issuance of our Senior Unsecured Notes in July 2014.
Our current ratio, defined as current assets over current liabilities, was 1.29 at December 31, 2014 as compared to 1.09 at
December 31, 2013, an increase of 18.3 per cent due in large part to the cash received from the issuance of our Senior
Unsecured Notes in July 2014 and five aircraft classified as assets held for sale being included in current assets.
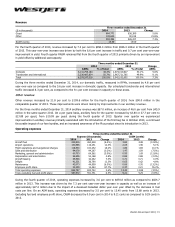
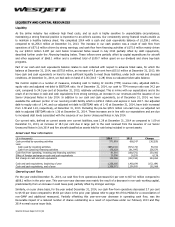
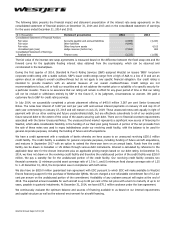
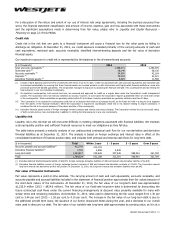
Select cash flow information
($ in thousands)
2014
2013
Change
Cash provided by operating activities
571,618
608,147
(36,529)
Less:
Cash used by investing activities (665,131) (715,172) 50,041
Cash from (used by) financing activities
175,023
(61,547)
236,570
Cash flow from operating, investing and financing activities 81,510 (168,572) 250,082
Effect of foreign exchange on cash and cash equivalents
20,556
16,378
4,178
Net change in cash and cash equivalents
102,066
(152,194)
254,260
Cash and cash equivalents, beginning of year 1,256,005 1,408,199 (152,194)
Cash and cash equivalents, end of year
1,358,071
1,256,005
102,066
Operating cash flows
For the year ended December 31, 2014, our cash flow from operations decreased 6.0 per cent to $571.6 million compared to
$608.1 million in the prior year. This year-over-year decrease was mainly the result of a decrease in non-cash working capital,
predominantly from an increase in cash taxes paid, partially offset by stronger earnings.
Similarly, on a per share basis, for the year ended December 31, 2014, our cash flow from operations decreased 3.7 per cent
to $4.43 per share compared to $4.60 per share in the prior year (please refer to page 48 of this MD&A for a reconciliation of
non-GAAP and additional measures). Partially offsetting this year-over-year decrease in operating cash flow, was the
favourable impact of a reduced number of shares outstanding as a result of repurchase under our February 2013 and May
2014 normal course issuer bids.