Westjet 2014 Annual Report Download - page 14
Download and view the complete annual report
Please find page 14 of the 2014 Westjet annual report below. You can navigate through the pages in the report by either clicking on the pages listed below, or by using the keyword search tool below to find specific information within the annual report.-
 1
1 -
2
-
3
-
 4
4 -
 5
5 -
 6
6 -
 7
7 -
 8
8 -
 9
9 -
 10
10 -
 11
11 -
 12
12 -
 13
13 -
 14
14 -
 15
15 -
 16
16 -
 17
17 -
 18
18 -
 19
19 -
 20
20 -
 21
21 -
 22
22 -
 23
23 -
 24
24 -
25
-
26
-
27
-
28
-
29
-
30
-
31
-
32
-
33
-
34
-
35
-
36
-
37
-
38
-
39
-
40
-
41
-
42
-
43
-
44
-
45
-
46
-
47
-
48
-
49
-
50
-
51
-
52
-
53
-
54
-
55
-
56
-
57
-
58
-
59
-
60
-
61
-
62
-
63
-
64
-
65
-
66
-
67
-
68
-
69
-
70
-
71
-
72
-
73
-
74
-
75
-
76
-
77
-
78
-
79
-
80
-
81
-
82
-
83
-
84
-
85
-
86
-
87
-
88
-
89
-
90
-
91
 |
 |

WestJet Annual Report 2014│12
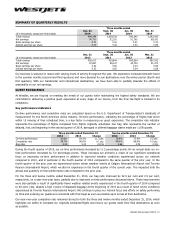
2014 RESULTS OF OPERATIONS
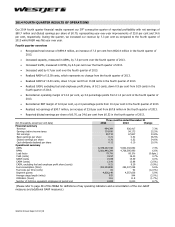
Revenue
($ in thousands) 2014 2013 Change
Guest
3,599,157
3,337,569
7.8%
Other 377,395 324,628 16.3%
3,976,552 3,662,197 8.6%
RASM (cents)
15.54
15.28
1.7%
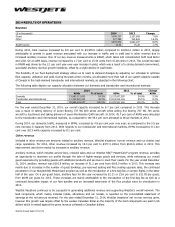
During 2014, total revenue increased by 8.6 per cent to $3,976.6 million compared to $3,662.2 million in 2013, largely
attributable to growth in guest revenue associated with our increase in traffic and in yield and in other revenue due to
increased ancillary revenue. One of our key revenue measurements is RASM, which takes into consideration both load factor
and yield. On an ASM basis, revenue increased by 1.7 per cent to 15.54 cents from 15.28 cents in 2013. The overall increase
in RASM was driven by the 2.1 per cent year-over-year increase in yield, which was a result of a strong demand environment,
successful ancillary revenue growth initiatives, offset by a slight decline in load factor.
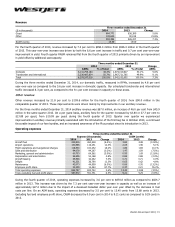
The flexibility of our fleet deployment strategy allows us to react to demand changes by adjusting our schedule to optimize
fleet capacity, utilization and yield. During the peak winter months, we allocated more than half of our system capacity outside
of Canada to the high-demand transborder and international markets, as depicted in the following chart.
The following table depicts our capacity allocation between our domestic and transborder and international markets:
2014
2013
Change
ASMs
% of total
ASMs
% of total
ASMs
Domestic
13,883,212,833
54.3%
13,157,007,097
54.9%
5.5%
Transborder and international 11,700,820,244 45.7% 10,813,914,163 45.1% 8.2%
Total
25,584,033,077
100.0%
23,970,921,260
100.0%
6.7%
For the year ended December 31, 2014, our overall capacity increased by 6.7 per cent compared to 2013. This increase
was a result of taking delivery of seven Boeing 737 NG 800 series aircraft while selling five Boeing 737 NG 700 series
aircraft to Southwest and taking delivery of seven Bombardier Q400 aircraft. In 2014, 45.7 per cent of ASMs were allocated
to the transborder and international markets, as compared to the 45.1 per cent allocated to those markets in 2013.
During 2014, our domestic traffic, measured in RPMs, increased by 4.8 per cent year over year, as compared to the 5.5 per
cent increase in capacity from 2013. With regards to our transborder and international markets, RPMs increased by 8.1 per
cent over 2013 while capacity increased by 8.2 per cent.
Other revenue
Included in other revenue are amounts related to ancillary revenue, WestJet Vacations’ non-air revenue and our charter and
cargo operations. For 2014, other revenue increased by 16.3 per cent to $377.4 million from $324.6 million in 2013. This
improvement was driven mainly by increases in ancillary revenue.
Ancillary revenue, which includes service fees, onboard sales and our WestJet RBC® MasterCard± program revenue, provides
an opportunity to maximize our profits through the sale of higher-margin goods and services, while enhancing our overall
guest experience by providing guests with additional products and services to meet their needs. For the year ended December
31, 2014, ancillary revenue was $216.5 million, an increase of 31.2 per cent from $165.0 million in 2013. This increase was
mainly due to increases in the number of guest bookings, pre-reserved seating and Plus seating upgrade sales, the continued
penetration of our WestJet RBC MasterCard program as well as the introduction of a first bag fee on certain flights in the latter
half of the year. On a per guest basis, ancillary fees for the year increased by $2.11 or 23.6 per cent to $11.05 per guest,
from $8.94 per guest for 2013. These increases are mainly attributable to the introduction of the first bag fee as well as a
continued favourable impact of our fare bundles and an increased awareness of the Plus product since its introduction in
2013.
WestJet Vacations continues to be successful in generating additional revenue and supporting WestJet’s overall network. The
land component, which mainly includes hotels, attractions and car rentals, is reported on the consolidated statement of
earnings at the net amount received. For the year ended December 31, 2014, WestJet Vacations’ net non-air revenue grew,
however this growth was largely offset by the weaker Canadian dollar as the majority of the land components are paid in US
dollars which is netted against the gross revenue collected in Canadian dollars.